Category comparisons
Bars, shares, rankings, funnels, targets and profile breakdowns.
Open Add widget and choose the exact tile name below. Standard tiles use a base renderer. Specialized widget tiles preload that renderer’s specialized view, field mappings and starter data. Both are editable in Studio. Read the shared data, styling and interaction guide before replacing starter data.
Screenshots. These are real Studio widgets with fictional sample data and example settings. Colors, labels and layout remain configurable. Select an image to view it at full size.
Bar
Standard · Picker tile bar_chart
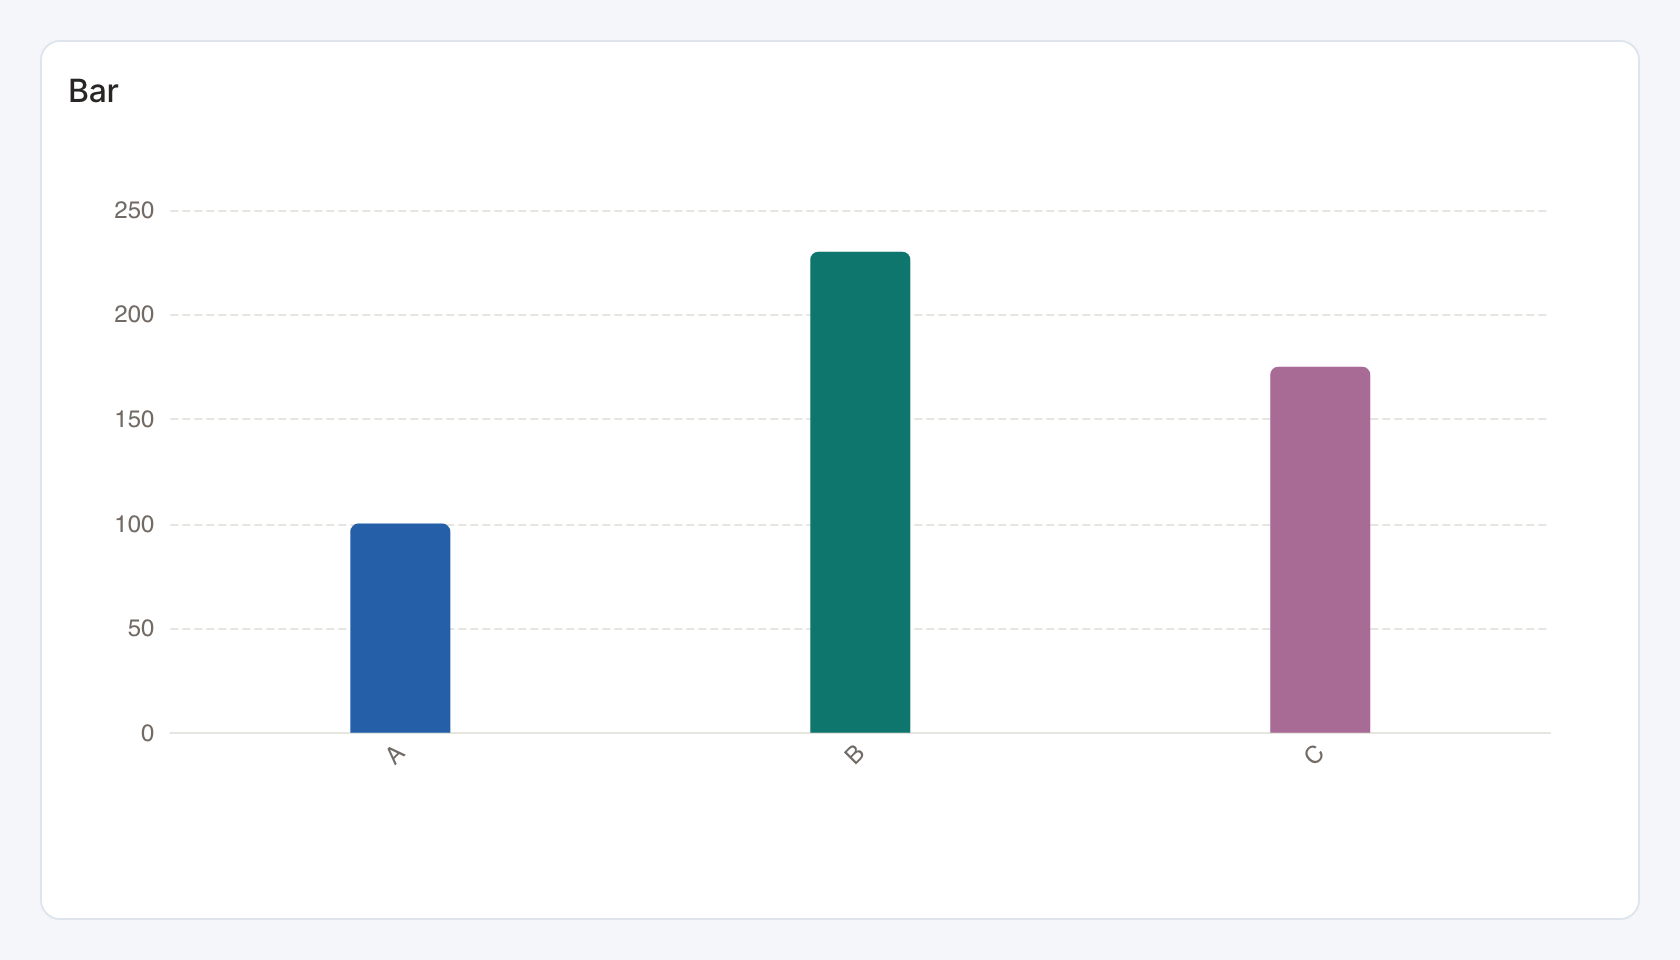
Required data and grain. One row per category. The first column supplies the label and the second the numeric bar value.
| Example field | Type | Role in this example |
|---|---|---|
category | Text | Required |
value | Number | Required |
Optional fields and bindings. Additional columns remain available in the data table but are not automatically separate bars.
Example result.
category | value |
|---|---|
A | 100 |
B | 230 |
C | 175 |
Download the complete data example. Select this tile to load its preset settings, then use these column names in the visual builder or the example query.
Styling controls. Choose horizontal or vertical orientation, palette and category colors, labels, grid, axes and value formatting. Allocate enough height for every category label.
Interactions. Marks can send the selected category to a configured filter or drill-through action in view and presentation modes. Test the receiving widget with the same category and filter name.
Check before publishing. Use Grouped / stacked bars for several measures or series per category.
Pie
Standard · Picker tile pie_chart
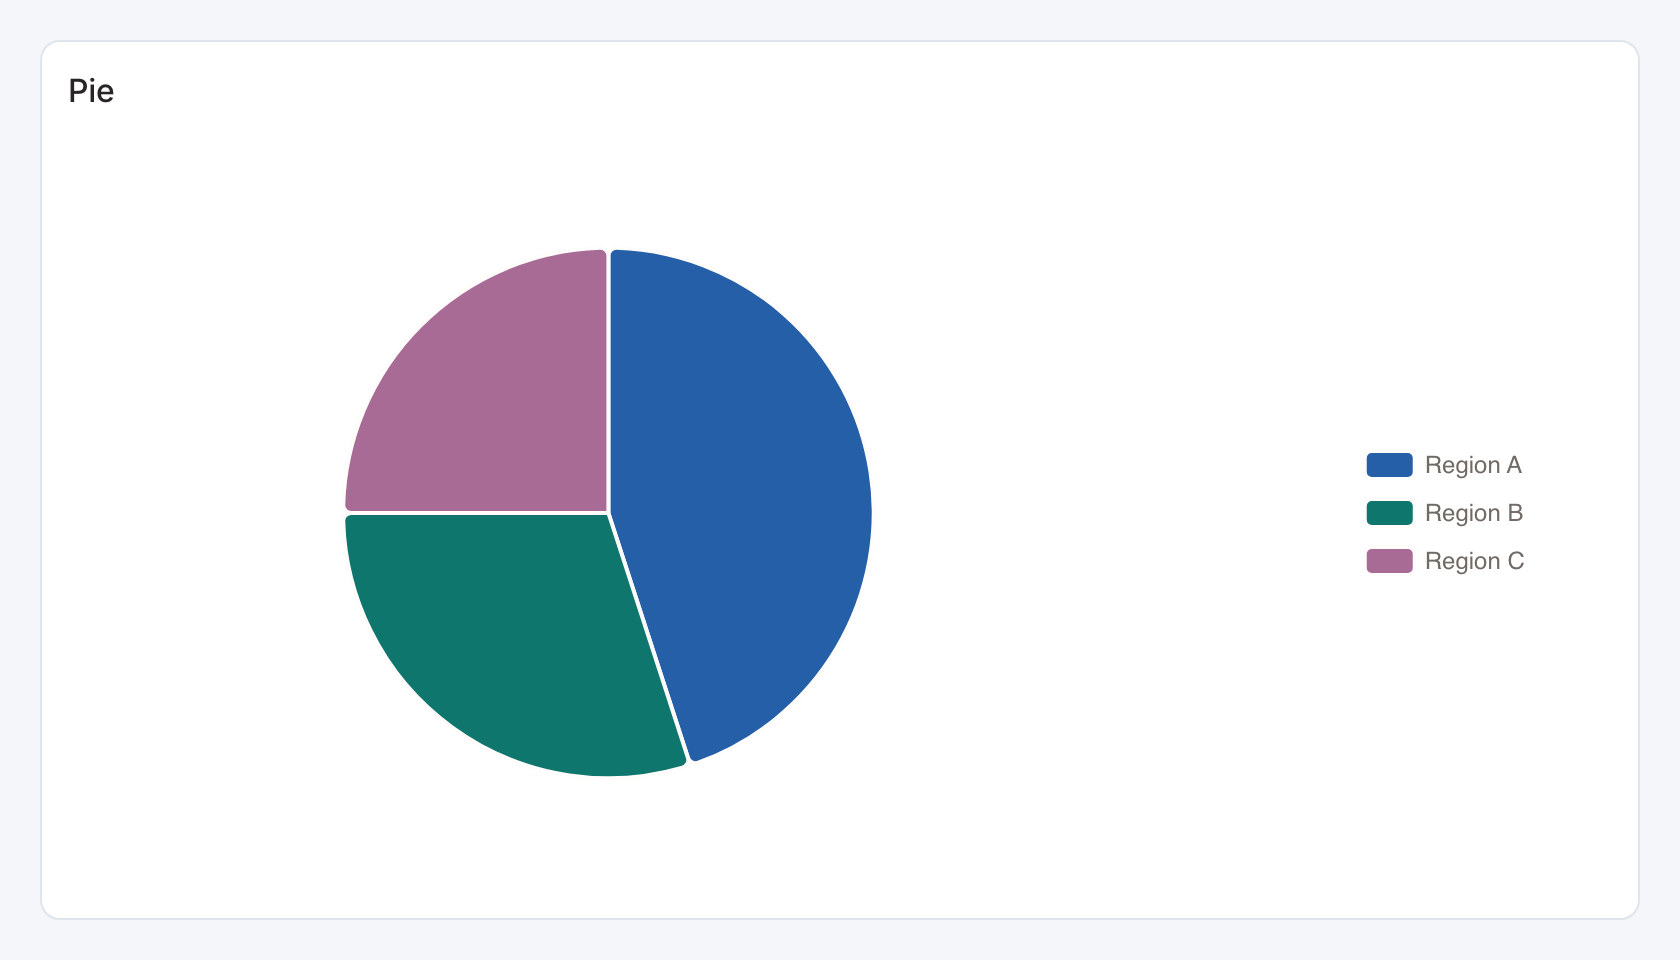
Required data and grain. One row per slice. The first column is its category and the second is its nonnegative magnitude.
| Example field | Type | Role in this example |
|---|---|---|
region | Text | Required |
share | Number | Required |
Optional fields and bindings. A category may be a region, product or segment. Aggregate repeated labels before rendering.
Example result.
region | share |
|---|---|
Region A | 45 |
Region B | 30 |
Region C | 25 |
Download the complete data example. Select this tile to load its preset settings, then use these column names in the visual builder or the example query.
Styling controls. Set palette, category colors, legend, labels and number formats. Donut details add center text, a center share or a complement.
Interactions. Marks can send the selected category to a configured filter or drill-through action in view and presentation modes. Test the receiving widget with the same category and filter name.
Check before publishing. Values are slice weights. The rendered slice share is calculated from their sum. Use fractions for an independently percent-formatted value.
Donut
Standard · Picker tile donut_chart
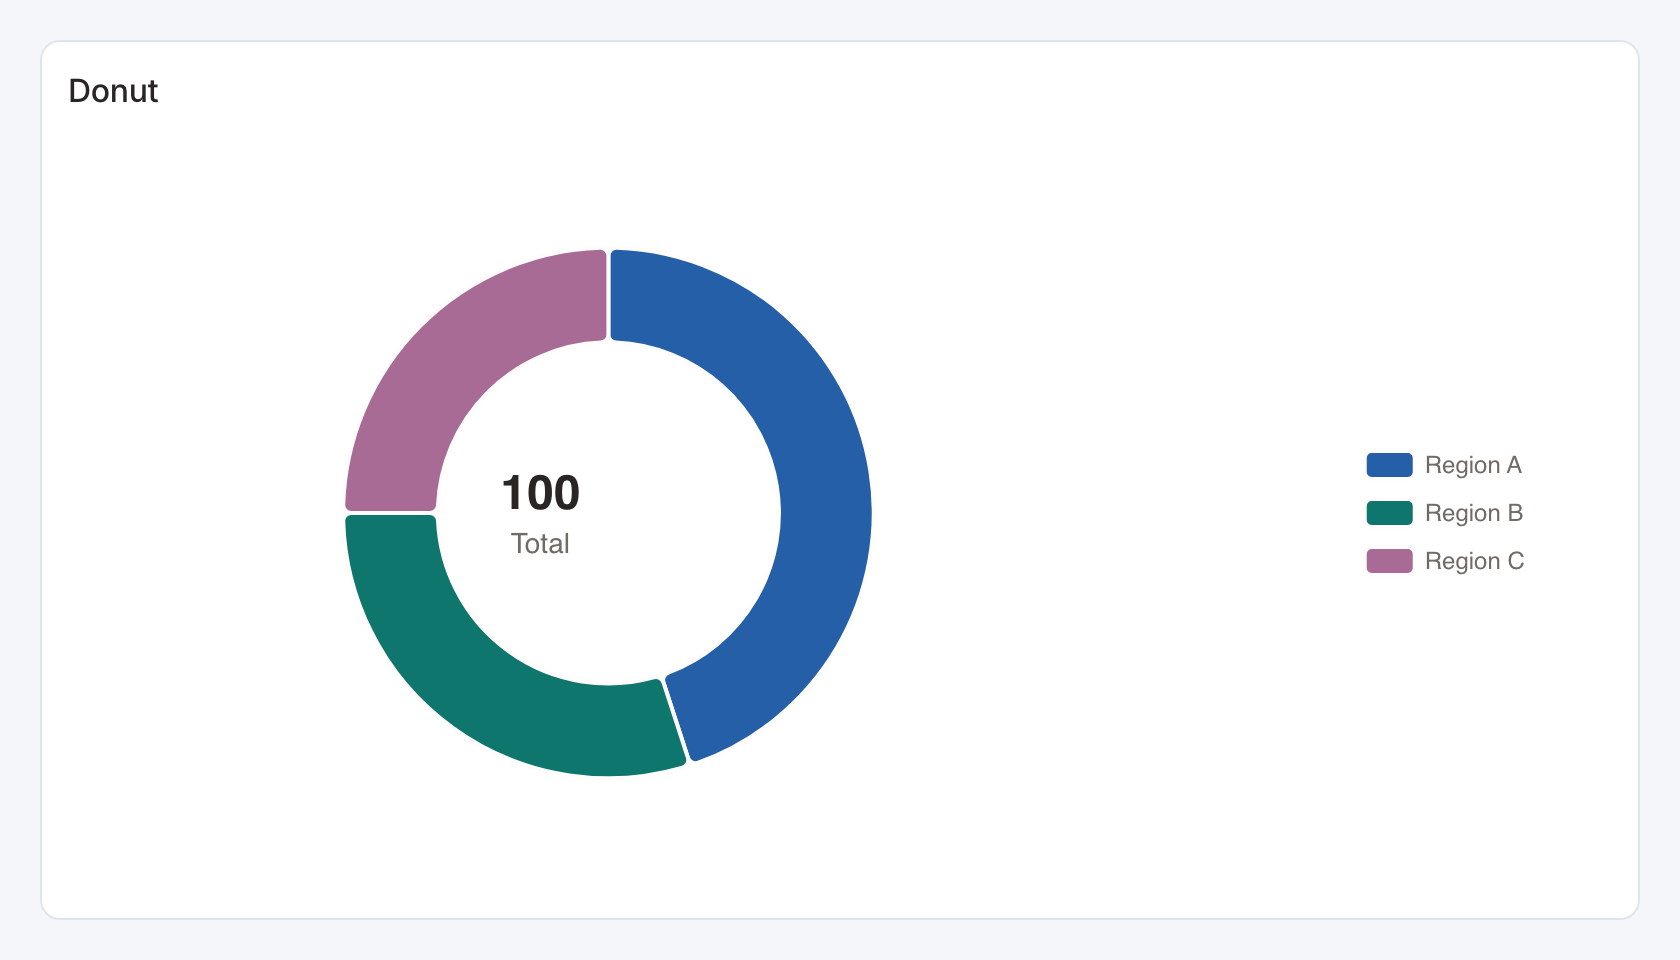
Required data and grain. One row per slice. The first column is its category and the second is its nonnegative magnitude.
| Example field | Type | Role in this example |
|---|---|---|
region | Text | Required |
share | Number | Required |
Optional fields and bindings. A category may be a region, product or segment. Aggregate repeated labels before rendering.
Example result.
region | share |
|---|---|
Region A | 45 |
Region B | 30 |
Region C | 25 |
Download the complete data example. Select this tile to load its preset settings, then use these column names in the visual builder or the example query.
Styling controls. Set palette, category colors, legend, labels and number formats. Donut details add center text, a center share or a complement.
Interactions. Marks can send the selected category to a configured filter or drill-through action in view and presentation modes. Test the receiving widget with the same category and filter name.
Check before publishing. Values are slice weights. The rendered slice share is calculated from their sum. Use fractions for an independently percent-formatted value.
Funnel
Standard · Picker tile funnel
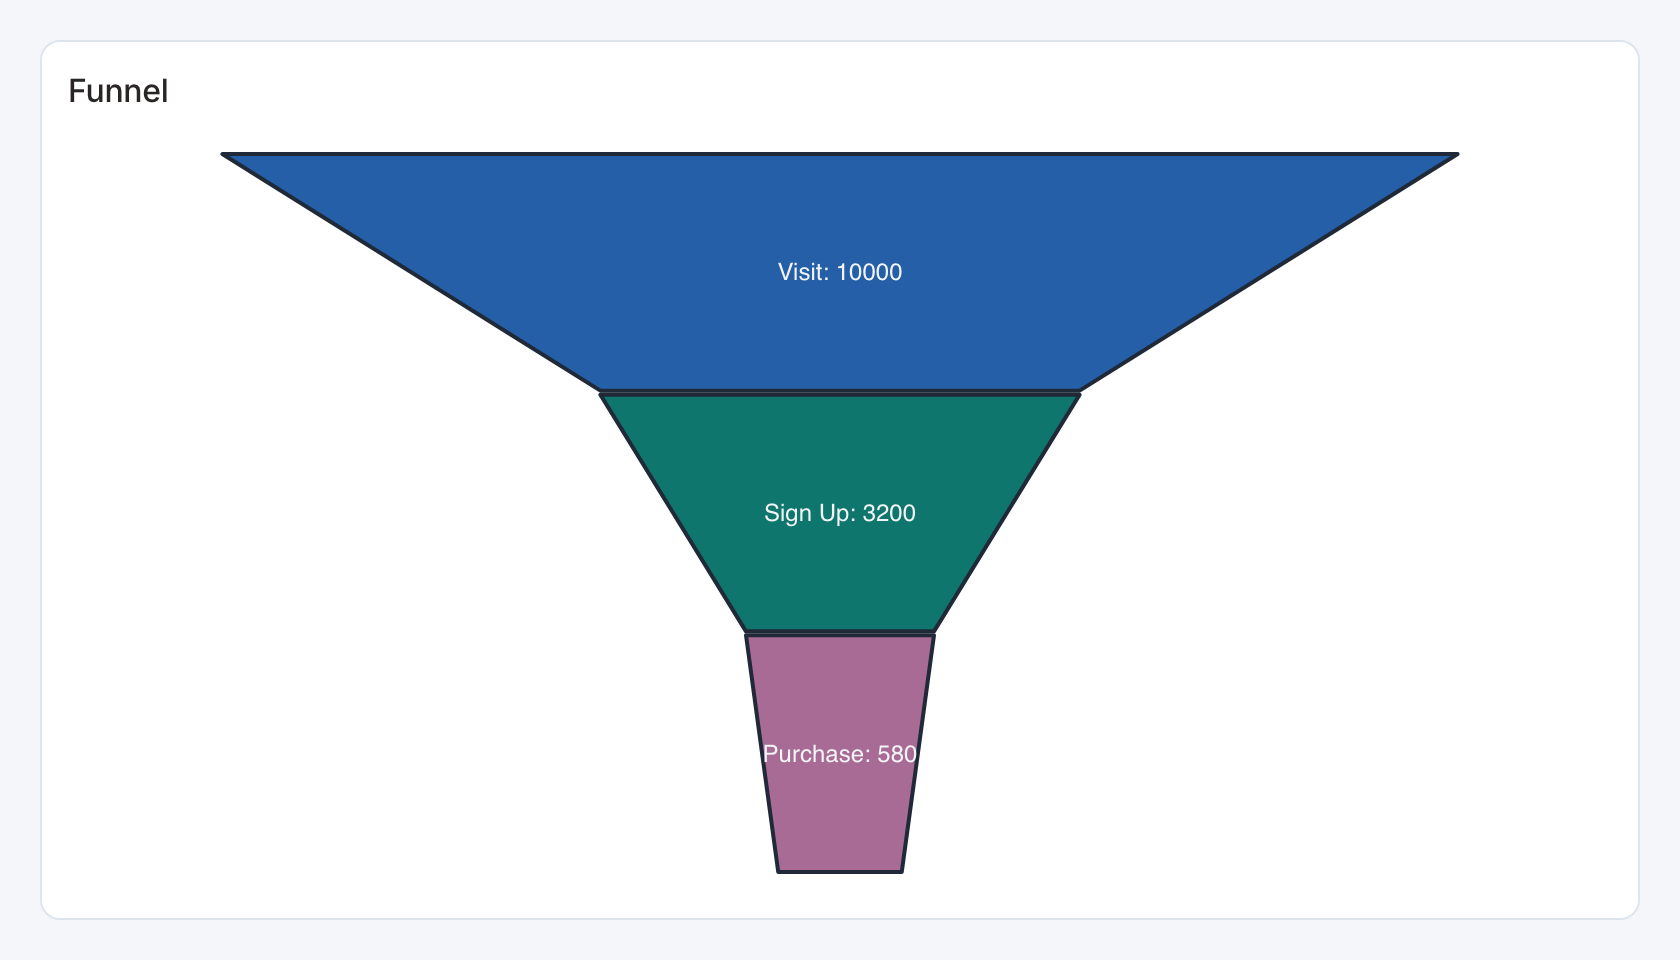
Required data and grain. One row per stage. The first column is the stage label and the second its numeric magnitude.
| Example field | Type | Role in this example |
|---|---|---|
step | Text | Required |
count | Number | Required |
Optional fields and bindings. Return stage rows in the intended progression.
Example result.
step | count |
|---|---|
Visit | 10000 |
Sign Up | 3200 |
Purchase | 580 |
Download the complete data example. Select this tile to load its preset settings, then use these column names in the visual builder or the example query.
Styling controls. Set palette, legend, stage labels and value format. Leave vertical space for all stages.
Interactions. Hover for values where a tooltip is shown. This renderer does not send mark selections to dashboard filters or drill-through.
Check before publishing. Use Conversion funnel for explicit stage order, previous-stage conversion rates, drop-off and selectable stages.
Waterfall
Standard · Picker tile waterfall
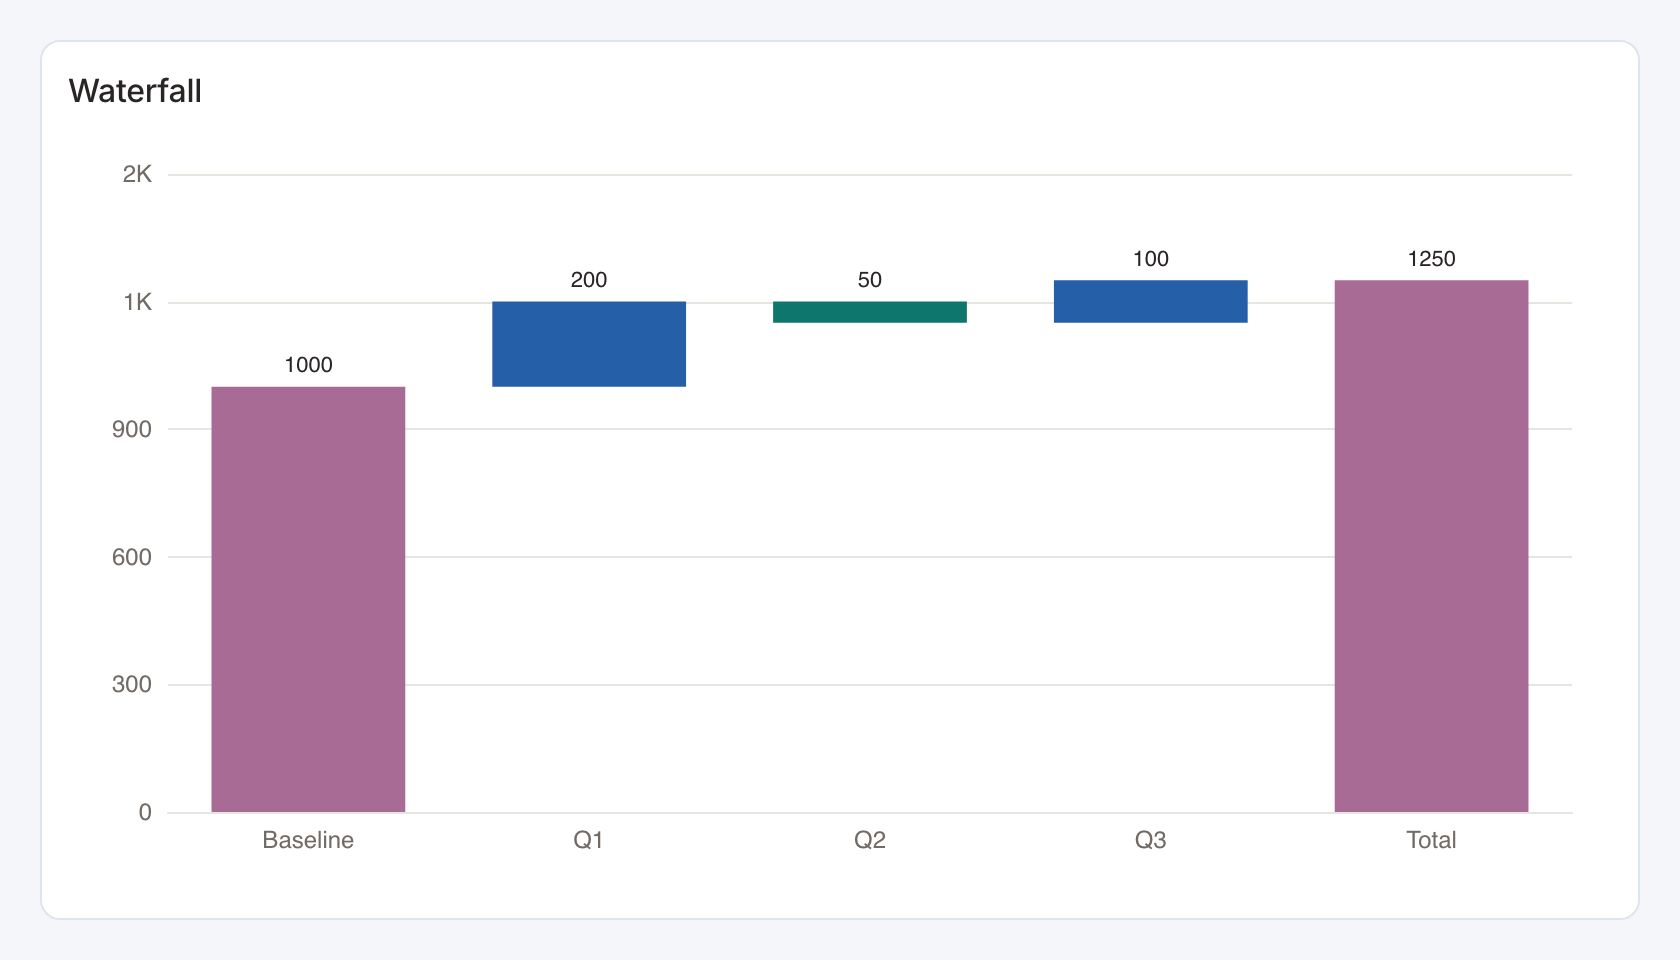
Required data and grain. One row per ordered contribution. First column is a label, second a signed numeric amount.
| Example field | Type | Role in this example |
|---|---|---|
label | Text | Required |
value | Number | Required |
Optional fields and bindings. Positive and negative changes build the running balance. Labels containing baseline, start or total are treated as balance anchors.
Example result — first three rows.
label | value |
|---|---|
Baseline | 1000 |
Q1 | 200 |
Q2 | -50 |
Download the complete data example. Select this tile to load its preset settings, then use these column names in the visual builder or the example query.
Styling controls. Set positive/negative palette, axis and value labels, title and number format.
Interactions. Marks can send the selected category to a configured filter or drill-through action in view and presentation modes. Test the receiving widget with the same category and filter name.
Check before publishing. Order the source deliberately and label total rows clearly. Reconcile the ending balance with the expected total.
Polar Bar
Standard · Picker tile polar_bar
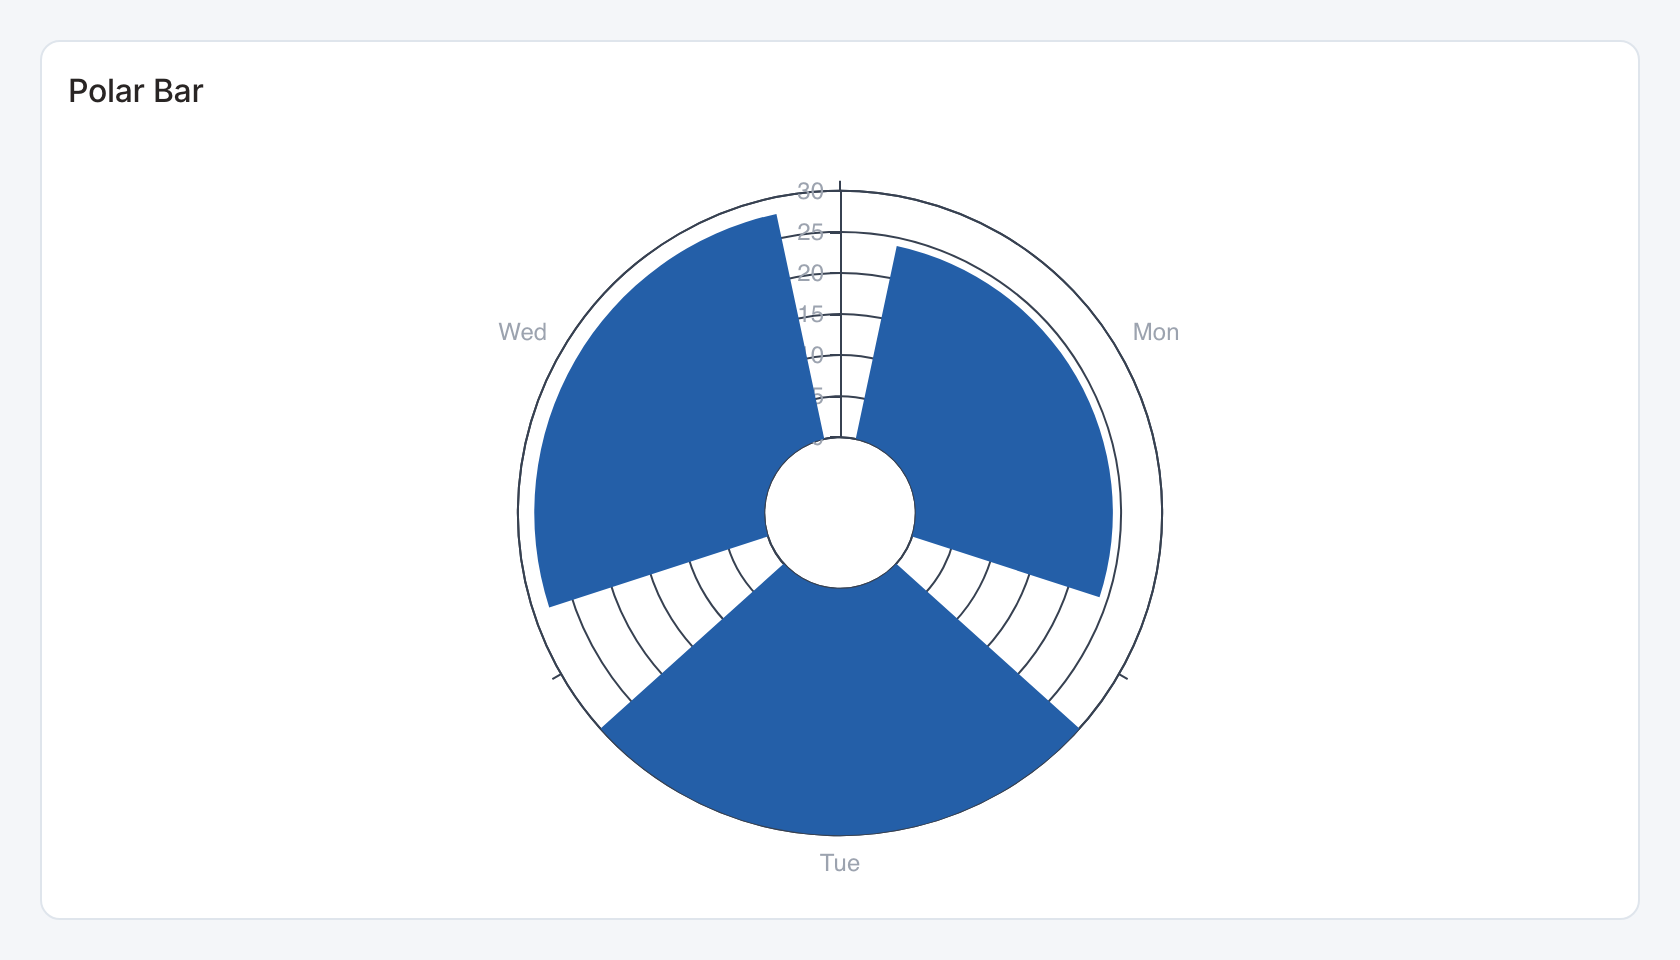
Required data and grain. One row per category. First column is label, second numeric value.
| Example field | Type | Role in this example |
|---|---|---|
label | Text | Required |
value | Number | Required |
Optional fields and bindings. Use a consistent magnitude unit across categories.
Example result.
label | value |
|---|---|
Mon | 24 |
Tue | 30 |
Wed | 28 |
Download the complete data example. Select this tile to load its preset settings, then use these column names in the visual builder or the example query.
Styling controls. Set palette, labels, legend and numeric format. Leave room for radial labels.
Interactions. Marks can send the selected category to a configured filter or drill-through action in view and presentation modes. Test the receiving widget with the same category and filter name.
Pictorial Bar
Standard · Picker tile pictorial_bar
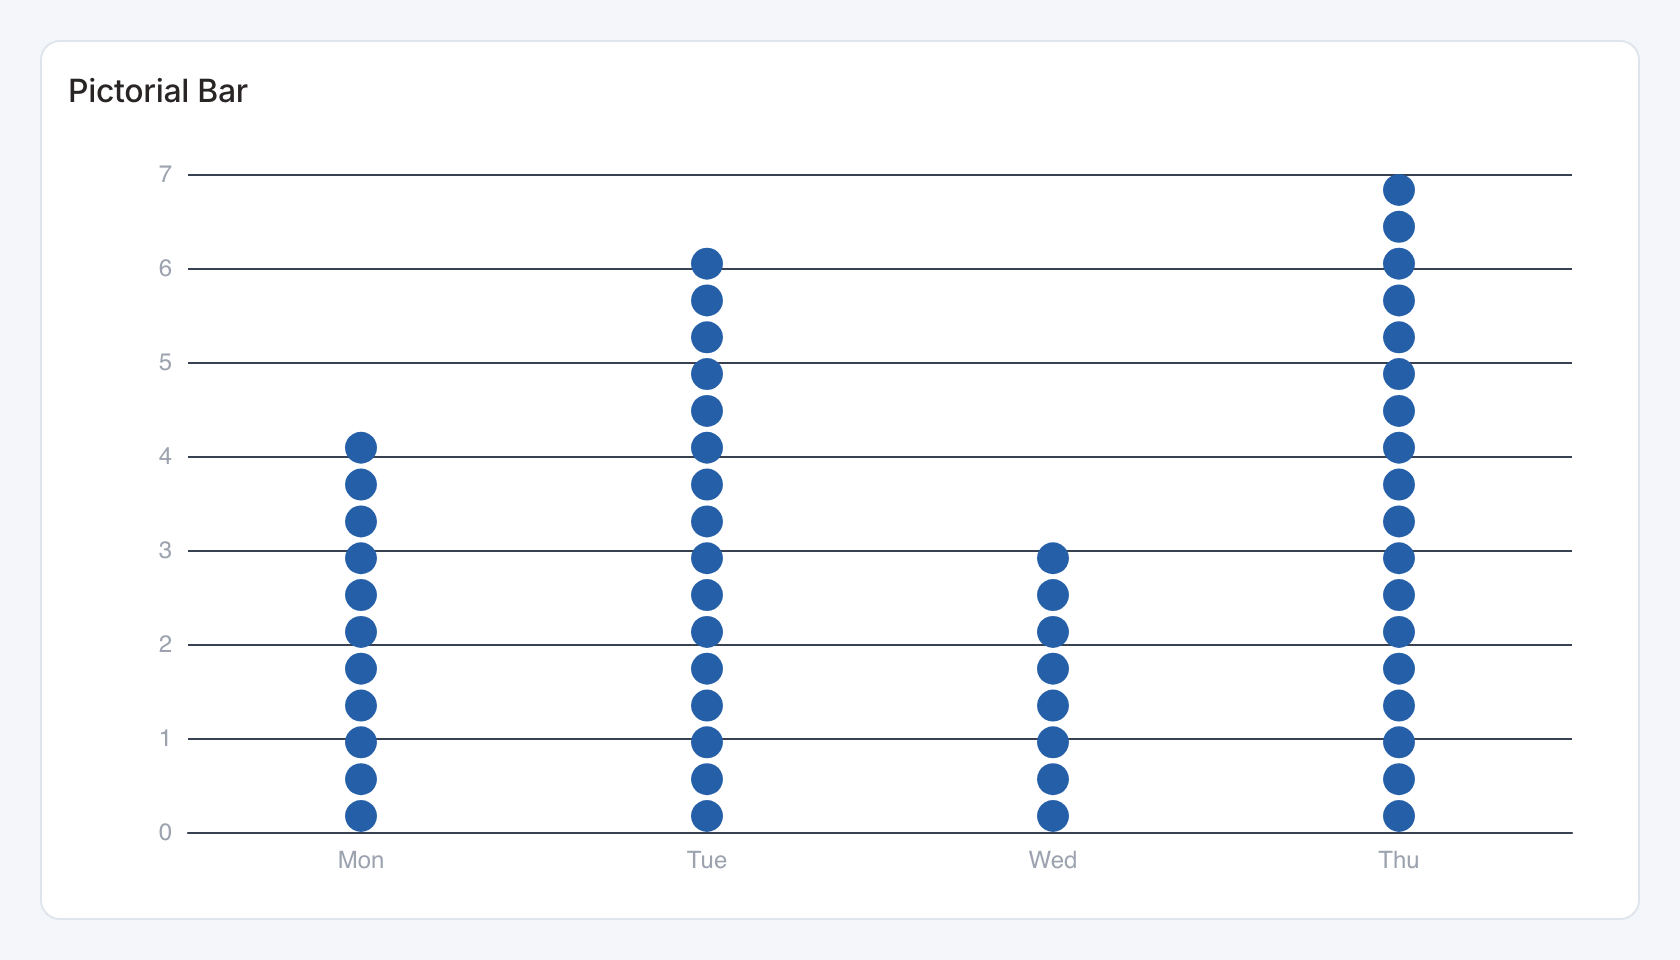
Required data and grain. One row per category. First column is a label and second numeric magnitude.
| Example field | Type | Role in this example |
|---|---|---|
label | Text | Required |
value | Number | Required |
Optional fields and bindings. Aggregate repeated categories and use nonnegative values.
Example result — first three rows.
label | value |
|---|---|
Mon | 4 |
Tue | 6 |
Wed | 3 |
Download the complete data example. Select this tile to load its preset settings, then use these column names in the visual builder or the example query.
Styling controls. Set palette, labels, axes and number format. Size the card for the pictorial marks.
Interactions. Hover for values where a tooltip is shown. This renderer does not send mark selections to dashboard filters or drill-through.
Bar Race
Standard · Picker tile bar_race
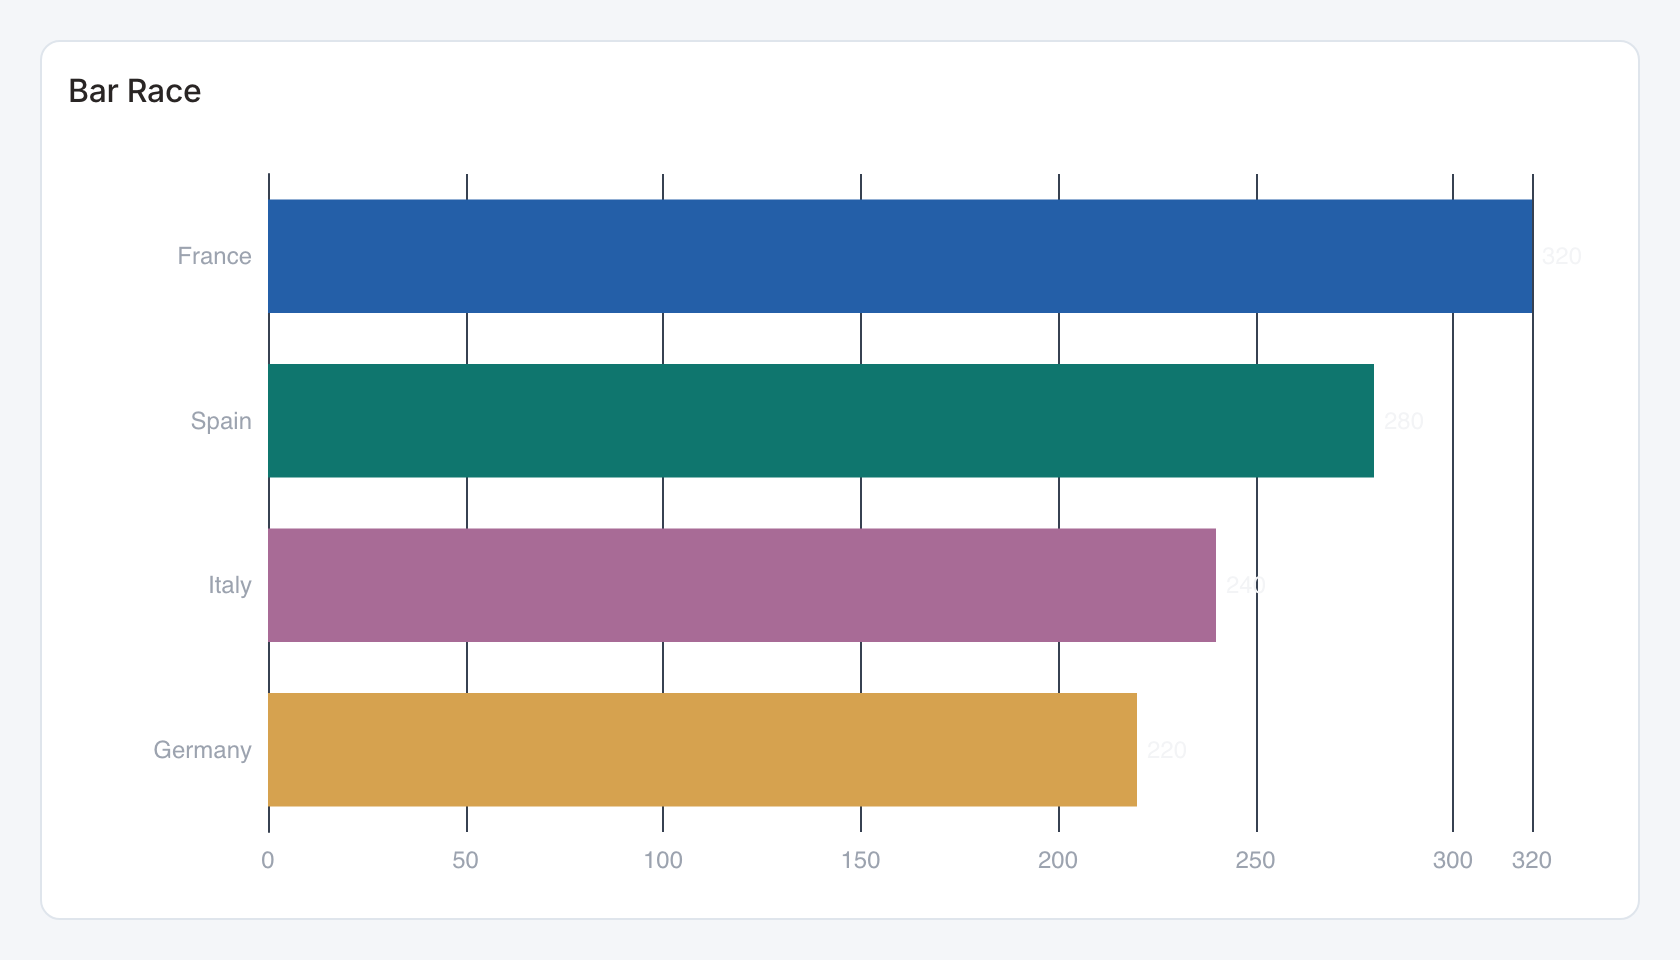
Required data and grain. One row per category for the current result. First column is label, second numeric value.
| Example field | Type | Role in this example |
|---|---|---|
label | Text | Required |
value | Number | Required |
Optional fields and bindings. Refresh the result with new values to animate changes.
Example result — first three rows.
label | value |
|---|---|
France | 320 |
Spain | 280 |
Italy | 240 |
Download the complete data example. Select this tile to load its preset settings, then use these column names in the visual builder or the example query.
Styling controls. Set palette, labels, axes and value format. Keep the category count small enough to read.
Interactions. Hover for values where a tooltip is shown. This renderer does not send mark selections to dashboard filters or drill-through.
Check before publishing. This renderer animates updates to the current result. Adding historical date rows does not automatically create a time-playback sequence.
Bullet
Standard · Picker tile bullet
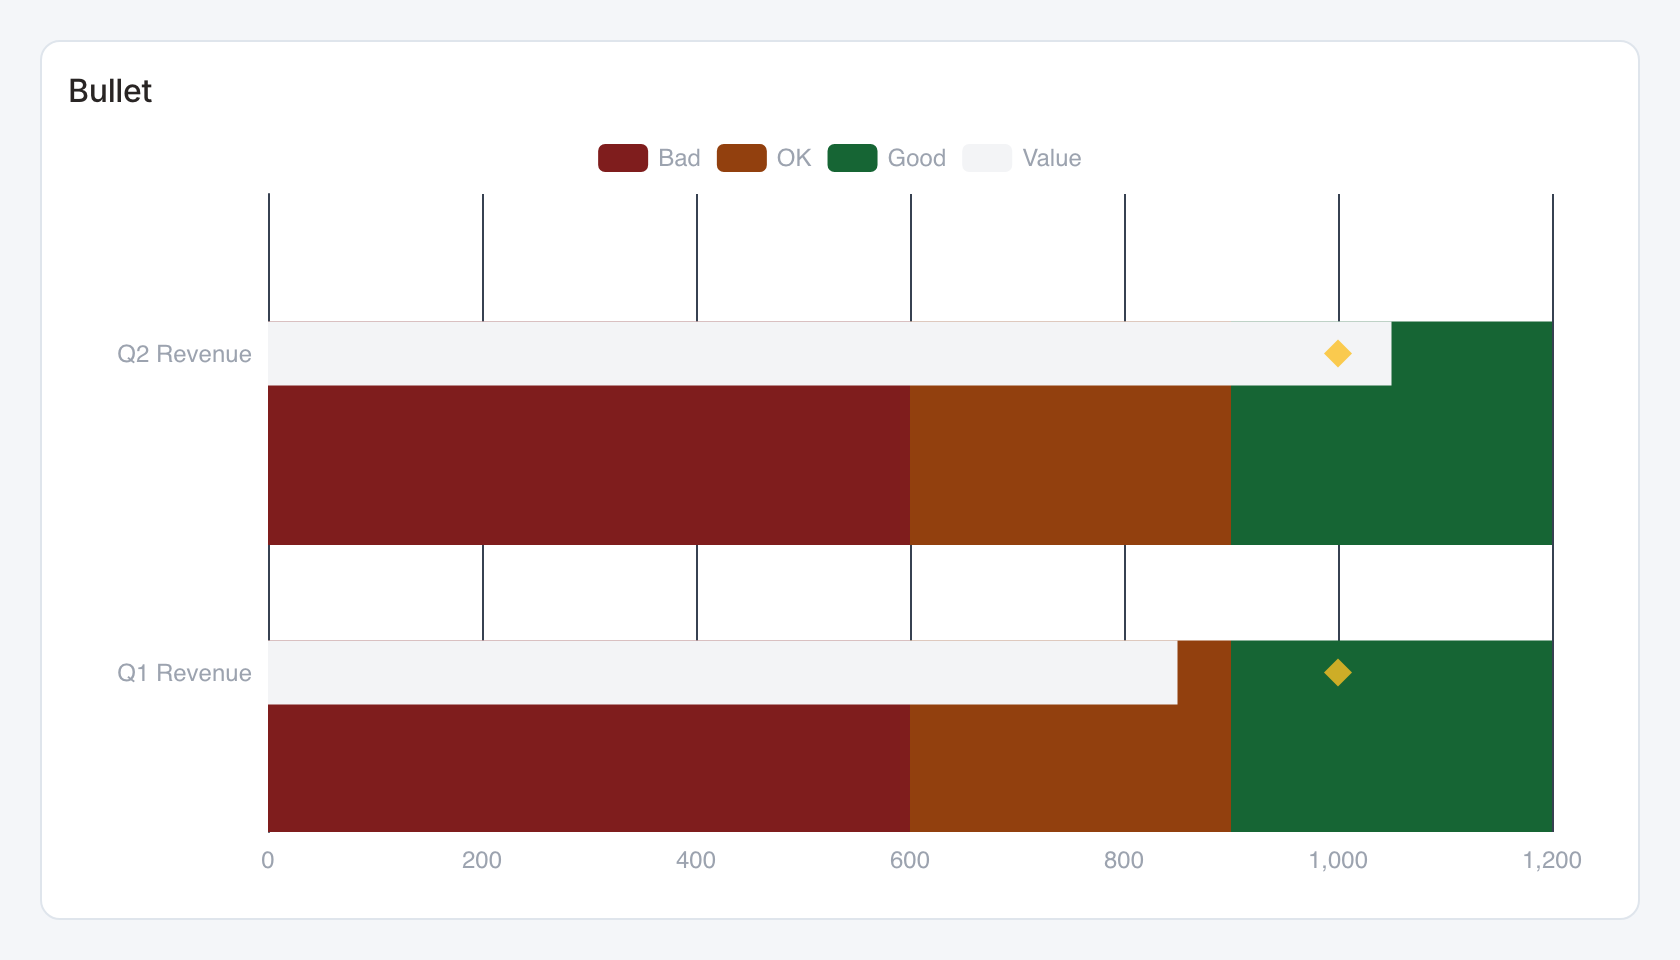
Required data and grain. One row per item. Columns are label, actual value and target.
| Example field | Type | Role in this example |
|---|---|---|
label | Text | Required |
value | Number | Required |
target | Number | Required |
bad | Number | Optional / available to map |
ok | Number | Optional / available to map |
good | Number | Optional / available to map |
Optional fields and bindings. Optional fourth, fifth and sixth columns are ordered bad/ok/good band boundaries. Without them the bands are derived from the target.
Example result.
label | value | target | bad | ok | good |
|---|---|---|---|---|---|
Q1 Revenue | 850 | 1000 | 600 | 900 | 1200 |
Q2 Revenue | 1050 | 1000 | 600 | 900 | 1200 |
Download the complete data example. Select this tile to load its preset settings, then use these column names in the visual builder or the example query.
Styling controls. Set colors, labels and numeric format. Keep all band bounds, target and actual in the same units.
Interactions. Hover for values where a tooltip is shown. This renderer does not send mark selections to dashboard filters or drill-through.
Check before publishing. Use Actual vs target or Bar and marker comparison when linked category actions are needed.
Conversion funnel
Specialized widget · Picker tile conversion-funnel
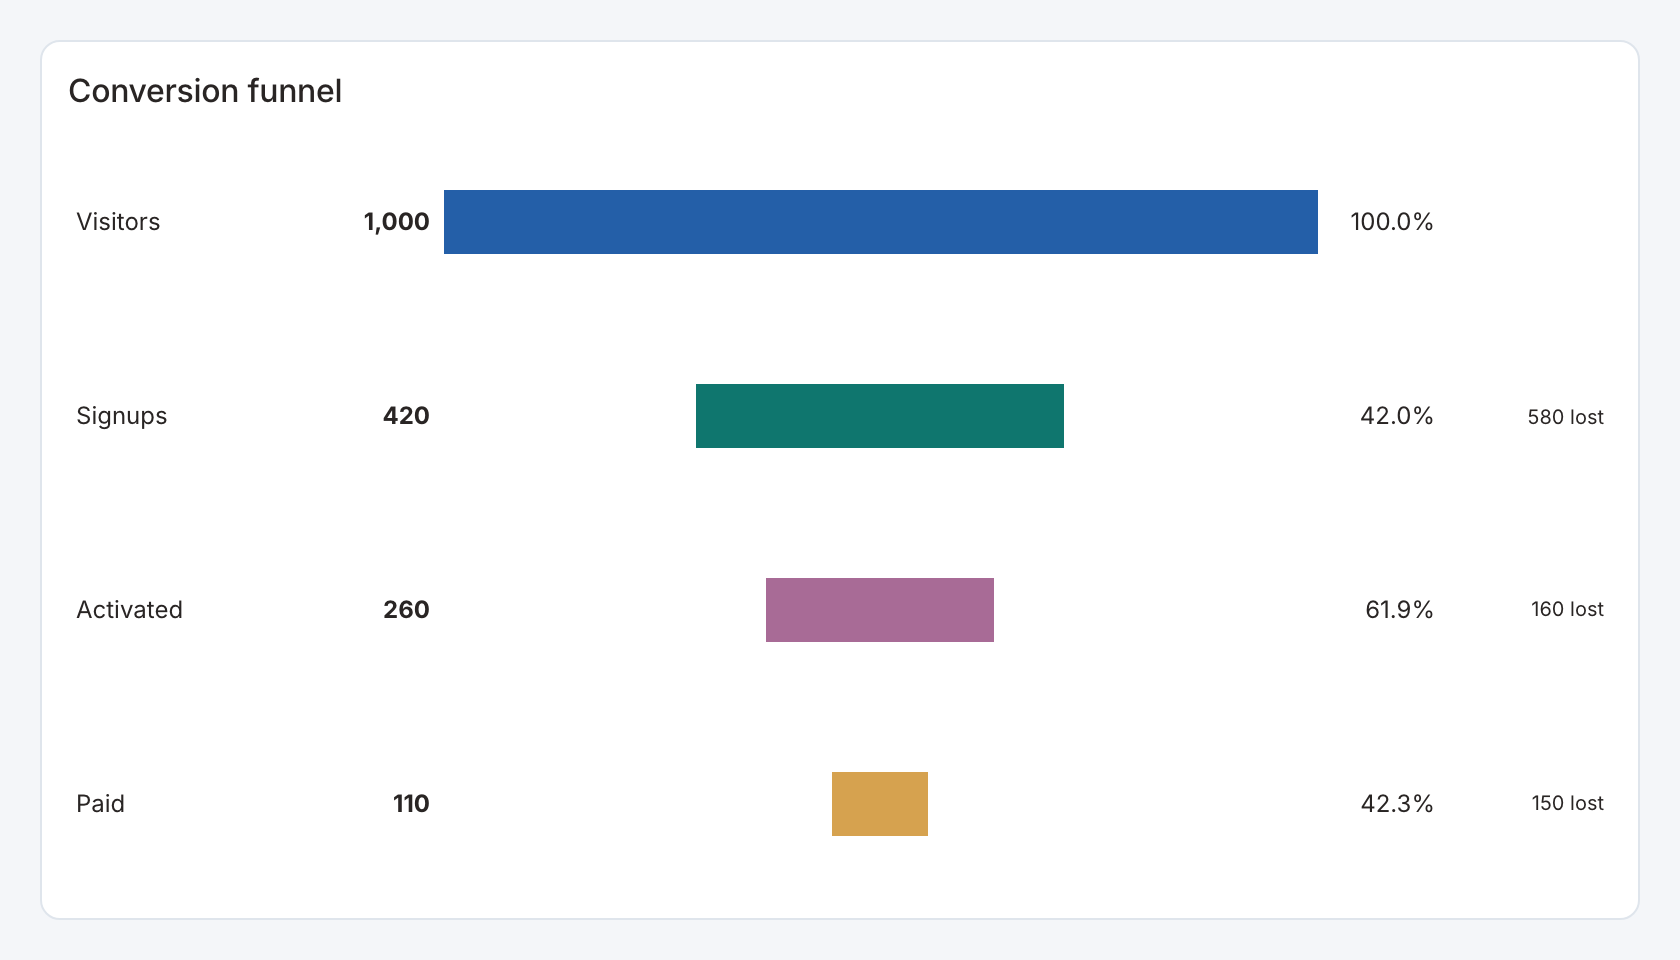
Required data and grain. One row per stage, with label, order and numeric count.
| Example field | Type | Role in this example |
|---|---|---|
stage | Text | Required |
stage_order | Number | Required |
value | Number | Required |
Optional fields and bindings. The order field is needed for the starter’s explicit progression. A separate selection column can provide a stable stage key.
Example result — first three rows.
stage | stage_order | value |
|---|---|---|
Visitors | 1 | 1000 |
Signups | 2 | 420 |
Activated | 3 | 260 |
Download the complete data example. Select this tile to load its preset settings, then use these column names in the visual builder or the example query.
Styling controls. Funnel controls set stage order, selection field, previous/first-stage conversion rates, drop-off visibility, colors and number format.
Interactions. Select a stage to send its configured stage value to an action. Hover to inspect counts and conversions.
Check before publishing. A zero or missing comparison count cannot produce a meaningful conversion rate. Keep numerator and comparison populations consistent.
Multi-measure comparison
Specialized widget · Picker tile measure-grid
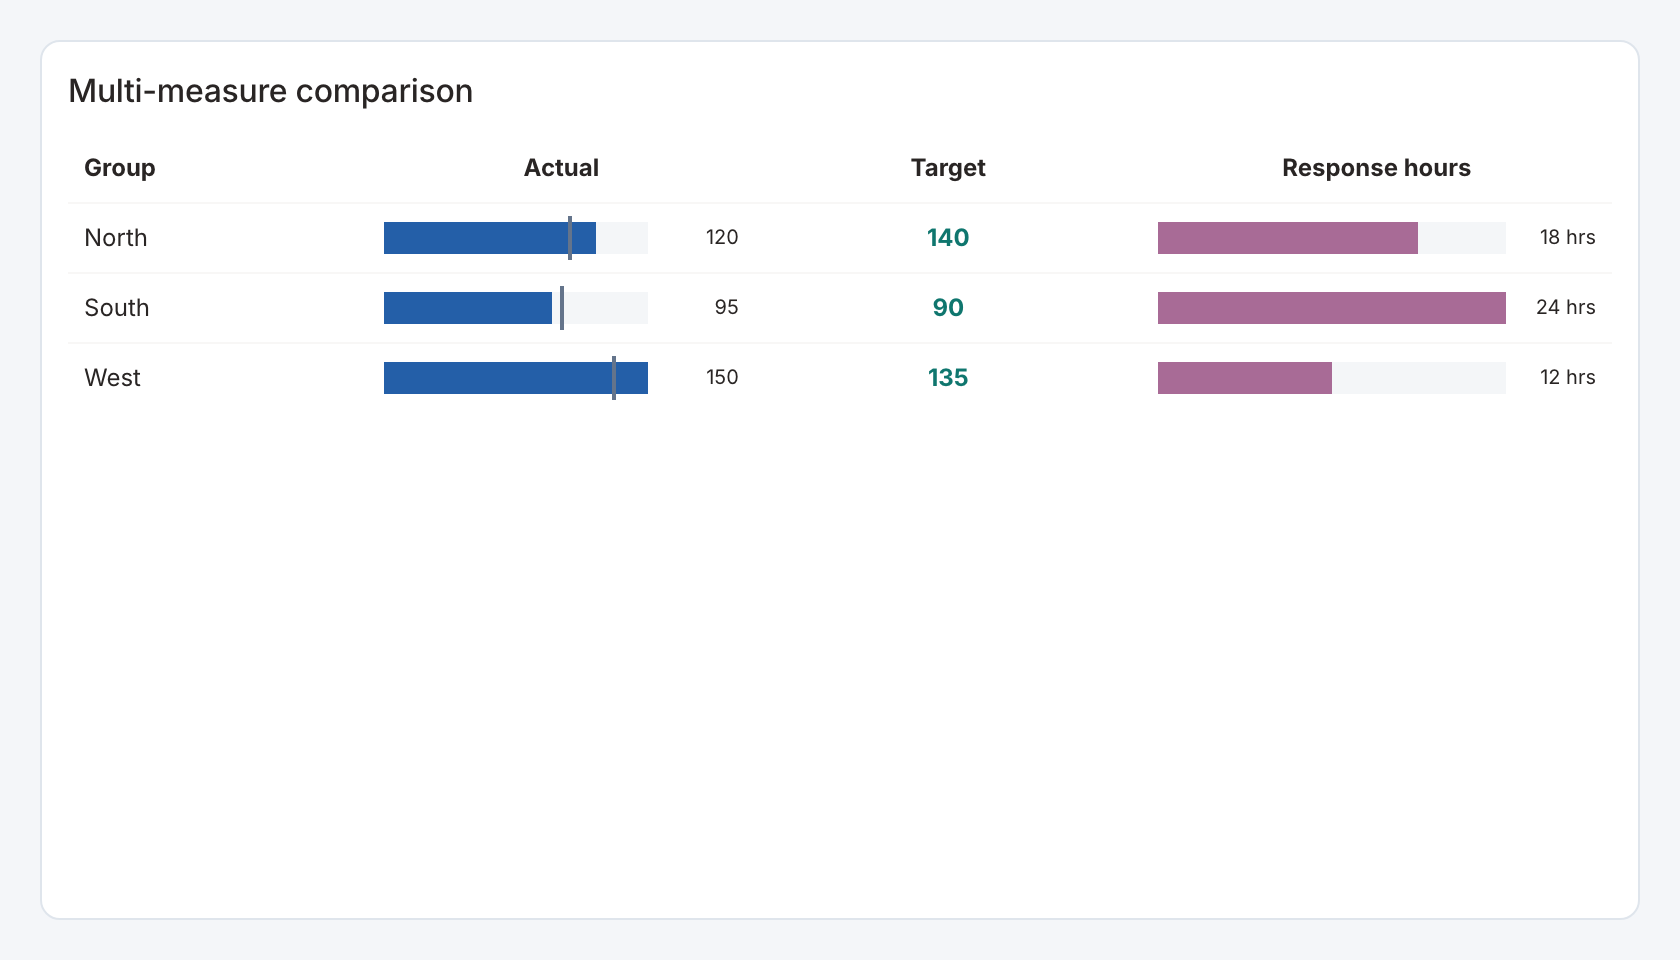
Required data and grain. One row per category, with a numeric field for every configured measure column.
| Example field | Type | Role in this example |
|---|---|---|
category | Text | Required |
value | Number | Required |
target | Number | Required |
previous | Number | Optional / available to map |
sample | Number | Optional / available to map |
secondary | Number | Required |
Optional fields and bindings. The starter uses previous for the Actual comparison. sample is extra data unless mapped.
Example result.
category | value | target | previous | sample | secondary |
|---|---|---|---|---|---|
North | 120 | 140 | 105 | 80 | 18 |
South | 95 | 90 | 100 | 64 | 24 |
West | 150 | 135 | 130 | 92 | 12 |
Download the complete data example. Select this tile to load its preset settings, then use these column names in the visual builder or the example query.
Styling controls. Define each measure column as bar or value, with label, comparison field, comparison label and its own number format. Set row ordering, colors and frame.
Interactions. Select category labels or actionable cells for configured actions. Use available sort controls to compare measures.
Check before publishing. Unlike a wide line chart, this view needs explicit measure-column definitions. Rename a source field and update its mapping.
Ranked shares
Specialized widget · Picker tile ranked-share
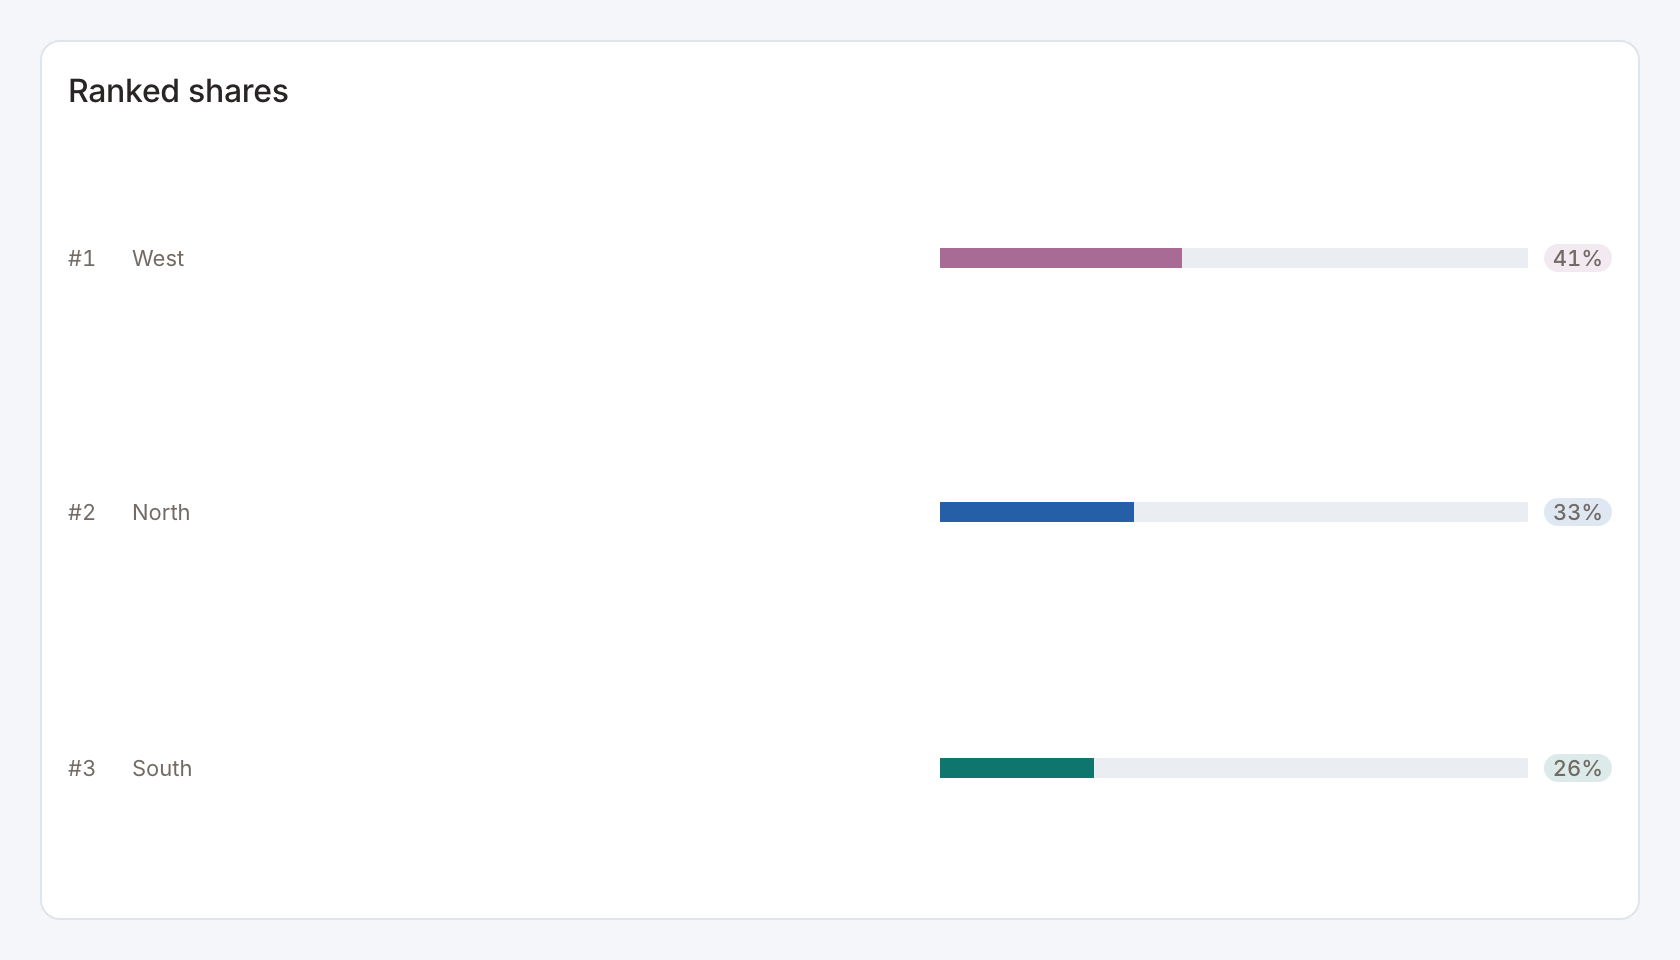
Required data and grain. One row per category and numeric magnitude.
| Example field | Type | Role in this example |
|---|---|---|
category | Text | Required |
value | Number | Required |
target | Number | Optional / available to map |
previous | Number | Optional / available to map |
sample | Number | Optional / available to map |
secondary | Number | Optional / available to map |
Optional fields and bindings. Additional fields can remain in the result for actions or the data table.
Example result.
category | value | target | previous | sample | secondary |
|---|---|---|---|---|---|
North | 120 | 140 | 105 | 80 | 18 |
South | 95 | 90 | 100 | 64 | 24 |
West | 150 | 135 | 130 | 92 | 12 |
Download the complete data example. Select this tile to load its preset settings, then use these column names in the visual builder or the example query.
Styling controls. Set category/value bindings, category colors, ranking labels, value format and share display.
Interactions. Select a ranked row to send its category to a configured action.
Check before publishing. Shares use the returned population. A source filter changes the denominator as well as the visible ranks.
Comparison bars
Specialized widget · Picker tile comparison-bars
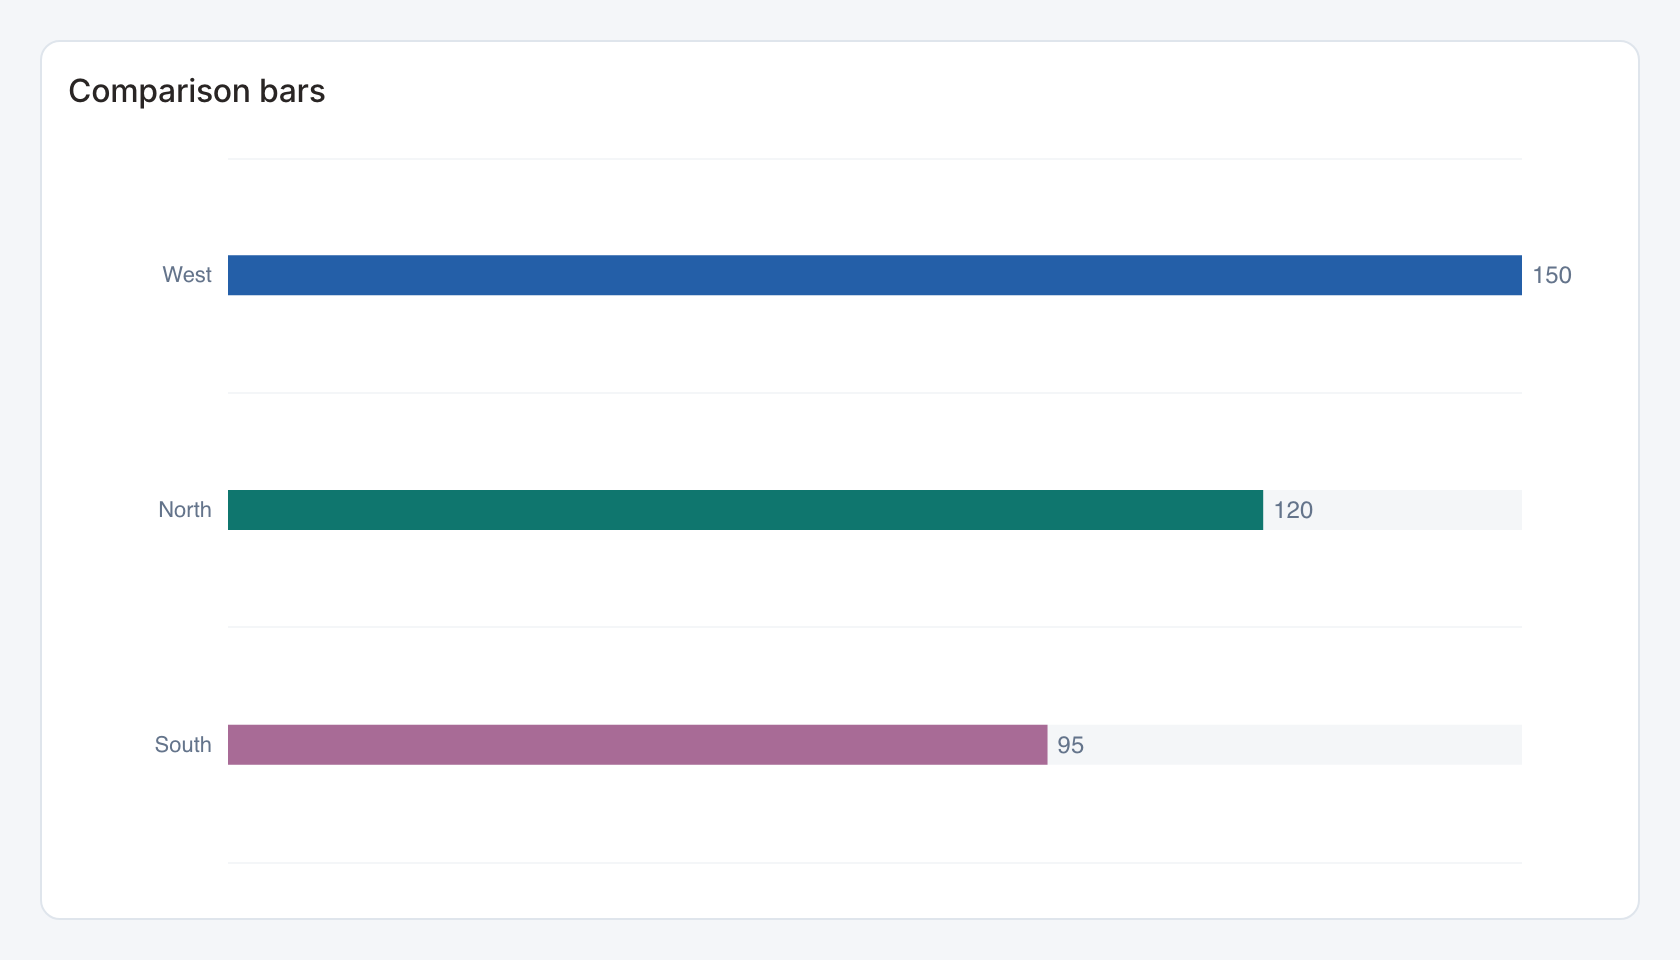
Required data and grain. One row per category with current numeric value.
| Example field | Type | Role in this example |
|---|---|---|
category | Text | Required |
value | Number | Required |
target | Number | Optional / available to map |
previous | Number | Optional / available to map |
sample | Number | Optional / available to map |
secondary | Number | Optional / available to map |
Optional fields and bindings. previous supplies an optional comparison. The source may contain extra target/sample fields that remain unused until mapped.
Example result.
category | value | target | previous | sample | secondary |
|---|---|---|---|---|---|
North | 120 | 140 | 105 | 80 | 18 |
South | 95 | 90 | 100 | 64 | 24 |
West | 150 | 135 | 130 | 92 | 12 |
Download the complete data example. Select this tile to load its preset settings, then use these column names in the visual builder or the example query.
Styling controls. Comparison controls set label width, order, label and value sizes, markers, palette, comparison field and value format.
Interactions. Marks can send the selected category to a configured filter or drill-through action in view and presentation modes. Test the receiving widget with the same category and filter name.
Check before publishing. Allow enough height for every row. A small card can hide or squeeze labels even when all source rows were returned.
Ranking with summary
Specialized widget · Picker tile ranked-bars
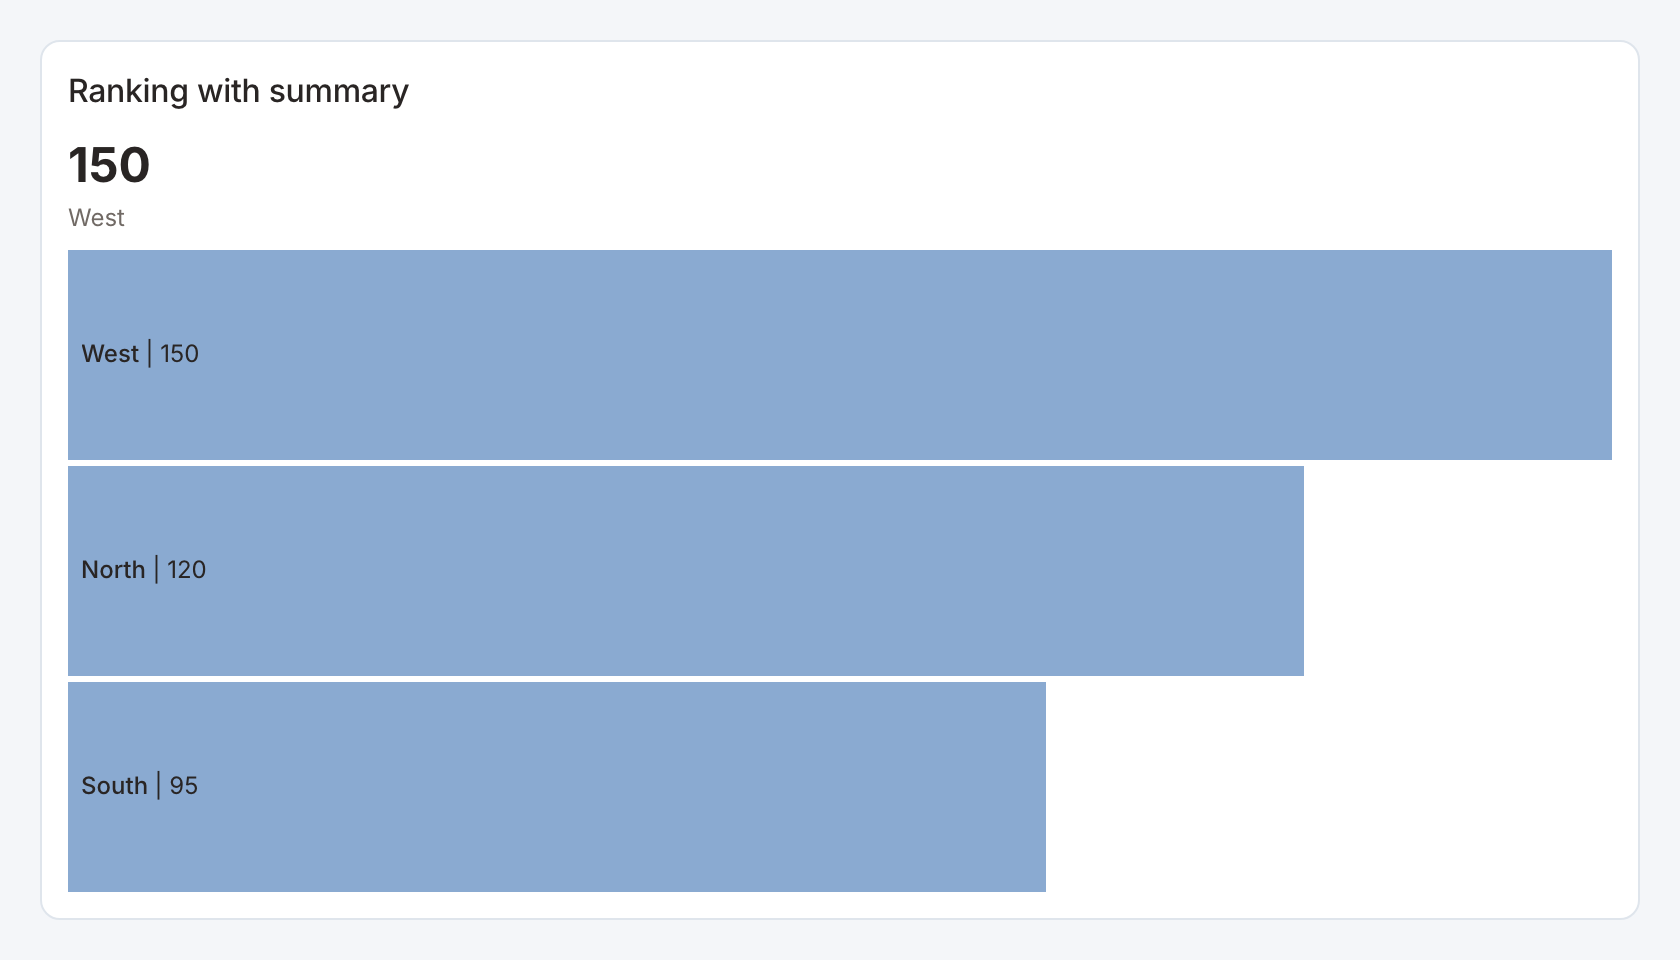
Required data and grain. One row per category and numeric value.
| Example field | Type | Role in this example |
|---|---|---|
category | Text | Required |
value | Number | Required |
target | Number | Optional / available to map |
previous | Number | Optional / available to map |
sample | Number | Optional / available to map |
secondary | Number | Optional / available to map |
Optional fields and bindings. Optional summary and top-N controls describe and limit the displayed ranking.
Example result.
category | value | target | previous | sample | secondary |
|---|---|---|---|---|---|
North | 120 | 140 | 105 | 80 | 18 |
South | 95 | 90 | 100 | 64 | 24 |
West | 150 | 135 | 130 | 92 | 12 |
Download the complete data example. Select this tile to load its preset settings, then use these column names in the visual builder or the example query.
Styling controls. Set top N, ranking direction, summary visibility, bar colors, row labels and number format.
Interactions. Marks can send the selected category to a configured filter or drill-through action in view and presentation modes. Test the receiving widget with the same category and filter name.
Check before publishing. A top-N summary describes the provided data and configured limit. Check whether you need an Other category in the source.
Paginated ranking
Specialized widget · Picker tile ranked-list
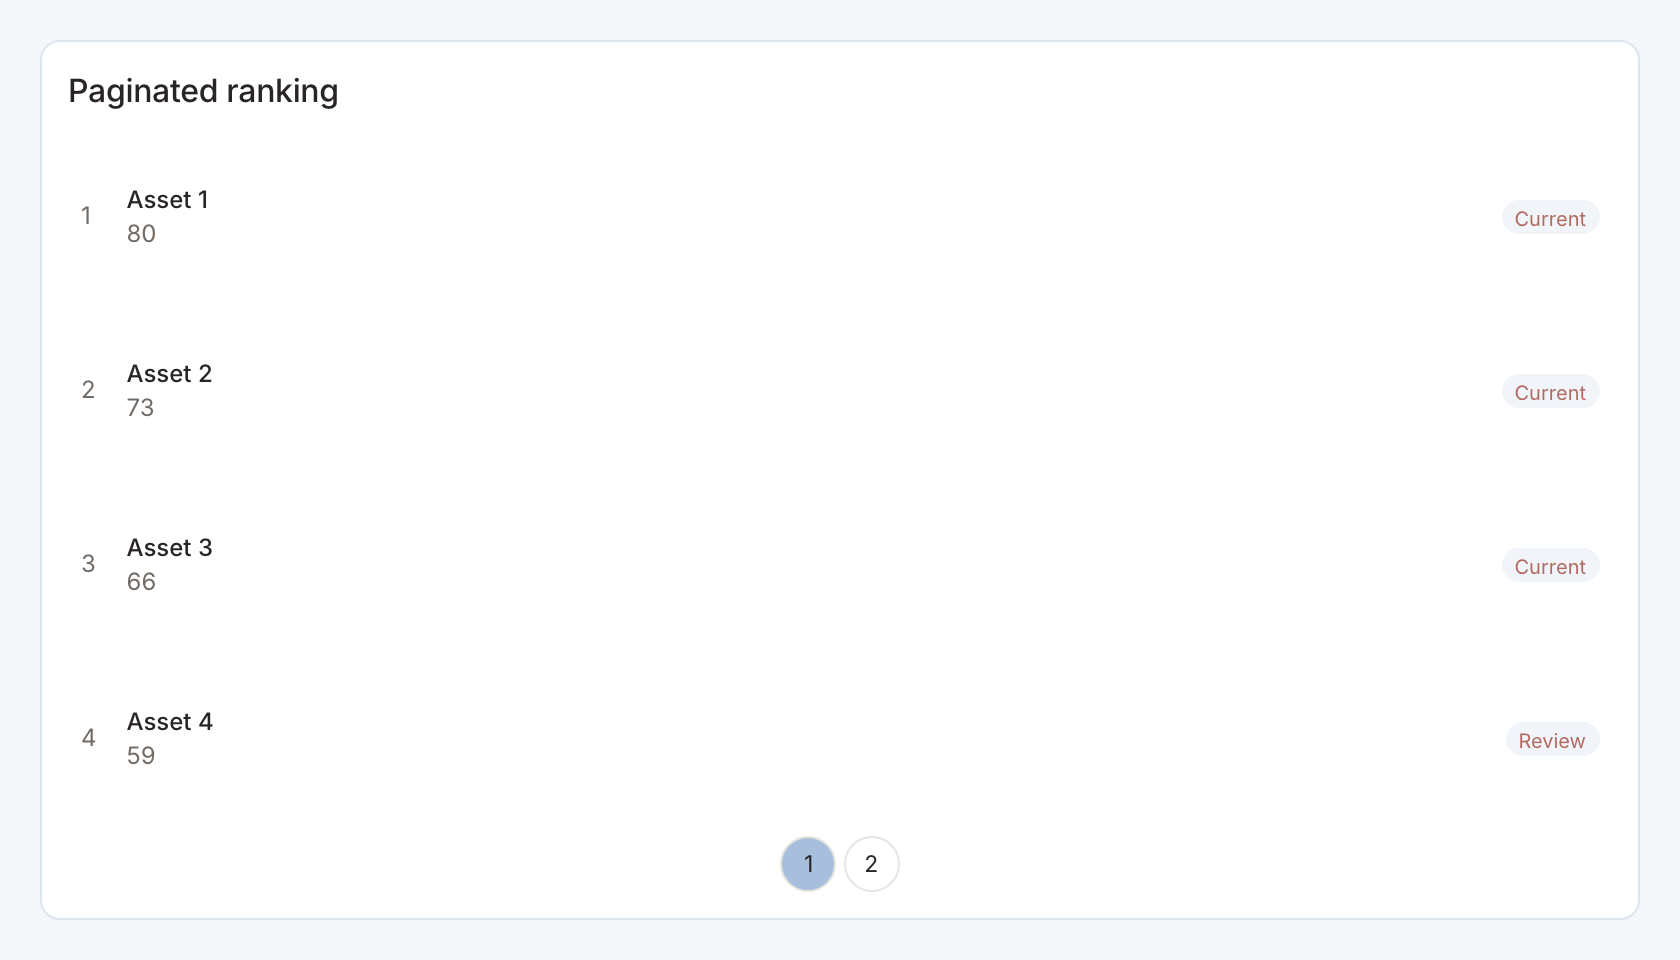
Required data and grain. One row per named item and numeric ranking measure.
| Example field | Type | Role in this example |
|---|---|---|
name | Text | Required |
value | Number | Required |
status | Text | Optional / available to map |
Optional fields and bindings. status is an optional per-row status label in the starter.
Example result — first three rows.
name | value | status |
|---|---|---|
Asset 1 | 80 | Current |
Asset 2 | 73 | Current |
Asset 3 | 66 | Current |
Download the complete data example. Select this tile to load its preset settings, then use these column names in the visual builder or the example query.
Styling controls. Ranking controls set page size, order, status field, labels, colors and value formatting.
Interactions. Move between ranking pages and select an item for a configured filter or drill-through action.
Check before publishing. Pagination controls display the returned results. Source limits still restrict which records can appear.
Actual vs target
Specialized widget · Picker tile target-bars
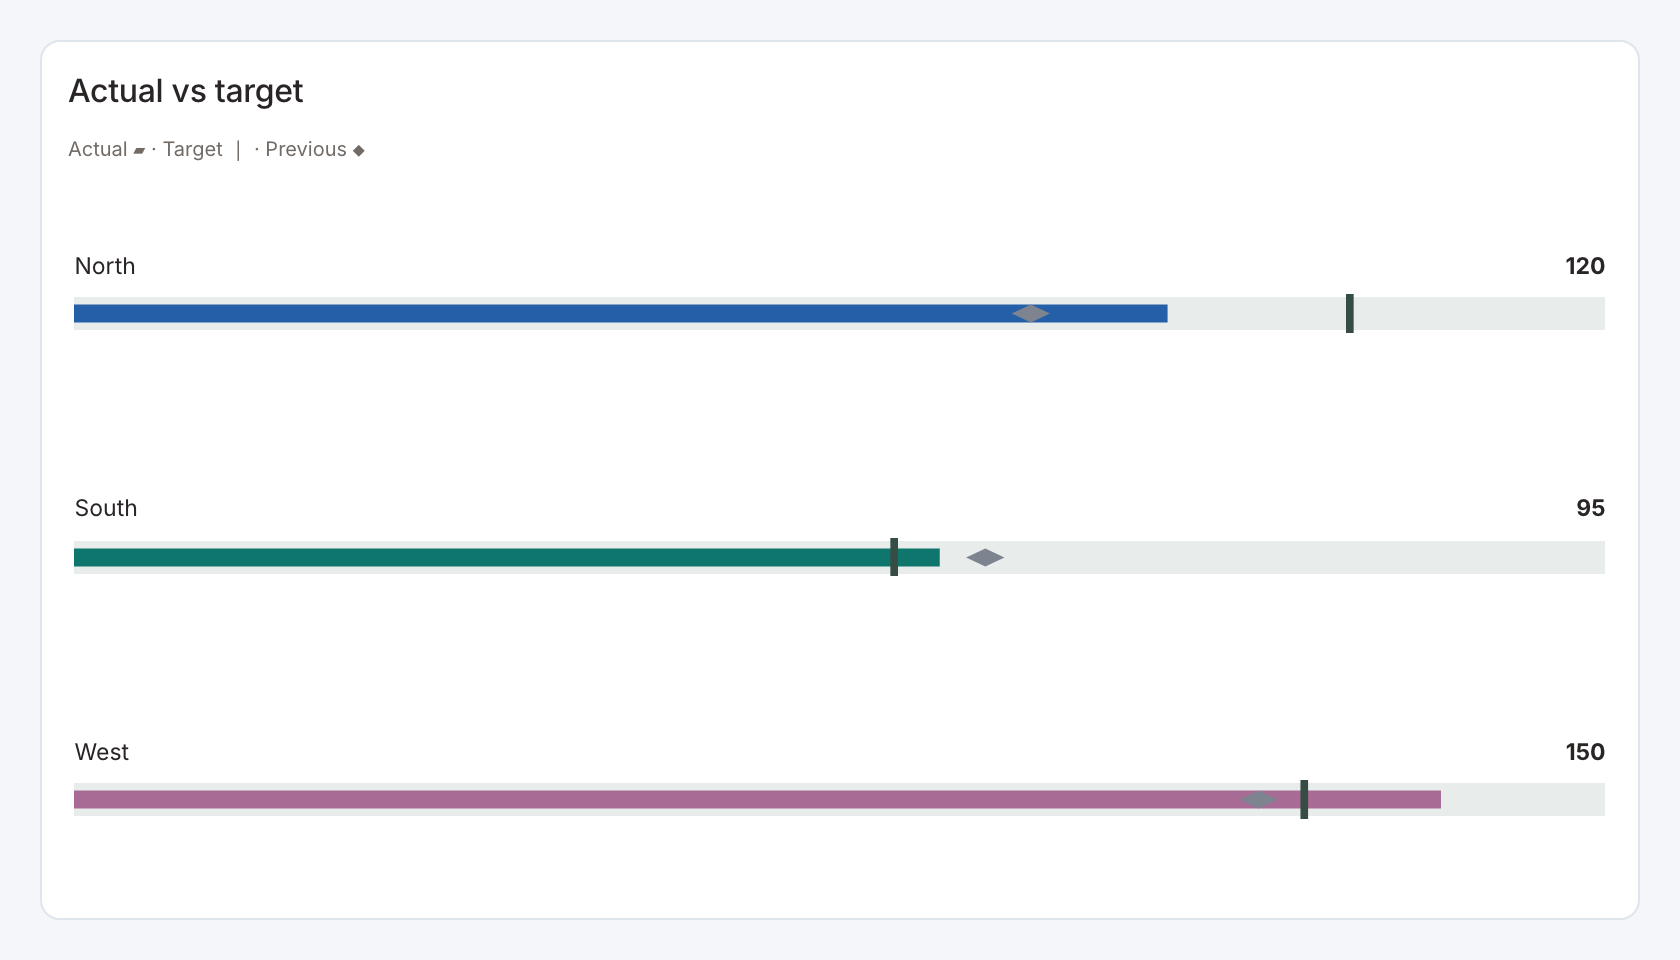
Required data and grain. One row per category, with actual and target in matching units.
| Example field | Type | Role in this example |
|---|---|---|
category | Text | Required |
value | Number | Required |
target | Number | Required |
previous | Number | Optional / available to map |
sample | Number | Optional / available to map |
secondary | Number | Optional / available to map |
Optional fields and bindings. previous is an optional prior-period comparison.
Example result.
category | value | target | previous | sample | secondary |
|---|---|---|---|---|---|
North | 120 | 140 | 105 | 80 | 18 |
South | 95 | 90 | 100 | 64 | 24 |
West | 150 | 135 | 130 | 92 | 12 |
Download the complete data example. Select this tile to load its preset settings, then use these column names in the visual builder or the example query.
Styling controls. Target controls choose target and previous fields, value visibility, palette, marker appearance and value format.
Interactions. Marks can send the selected category to a configured filter or drill-through action in view and presentation modes. Test the receiving widget with the same category and filter name.
Check before publishing. Decide whether a target is a ceiling or a goal. Color meaning should agree with the measure’s business direction.
Bar and marker comparison
Specialized widget · Picker tile bar-marker
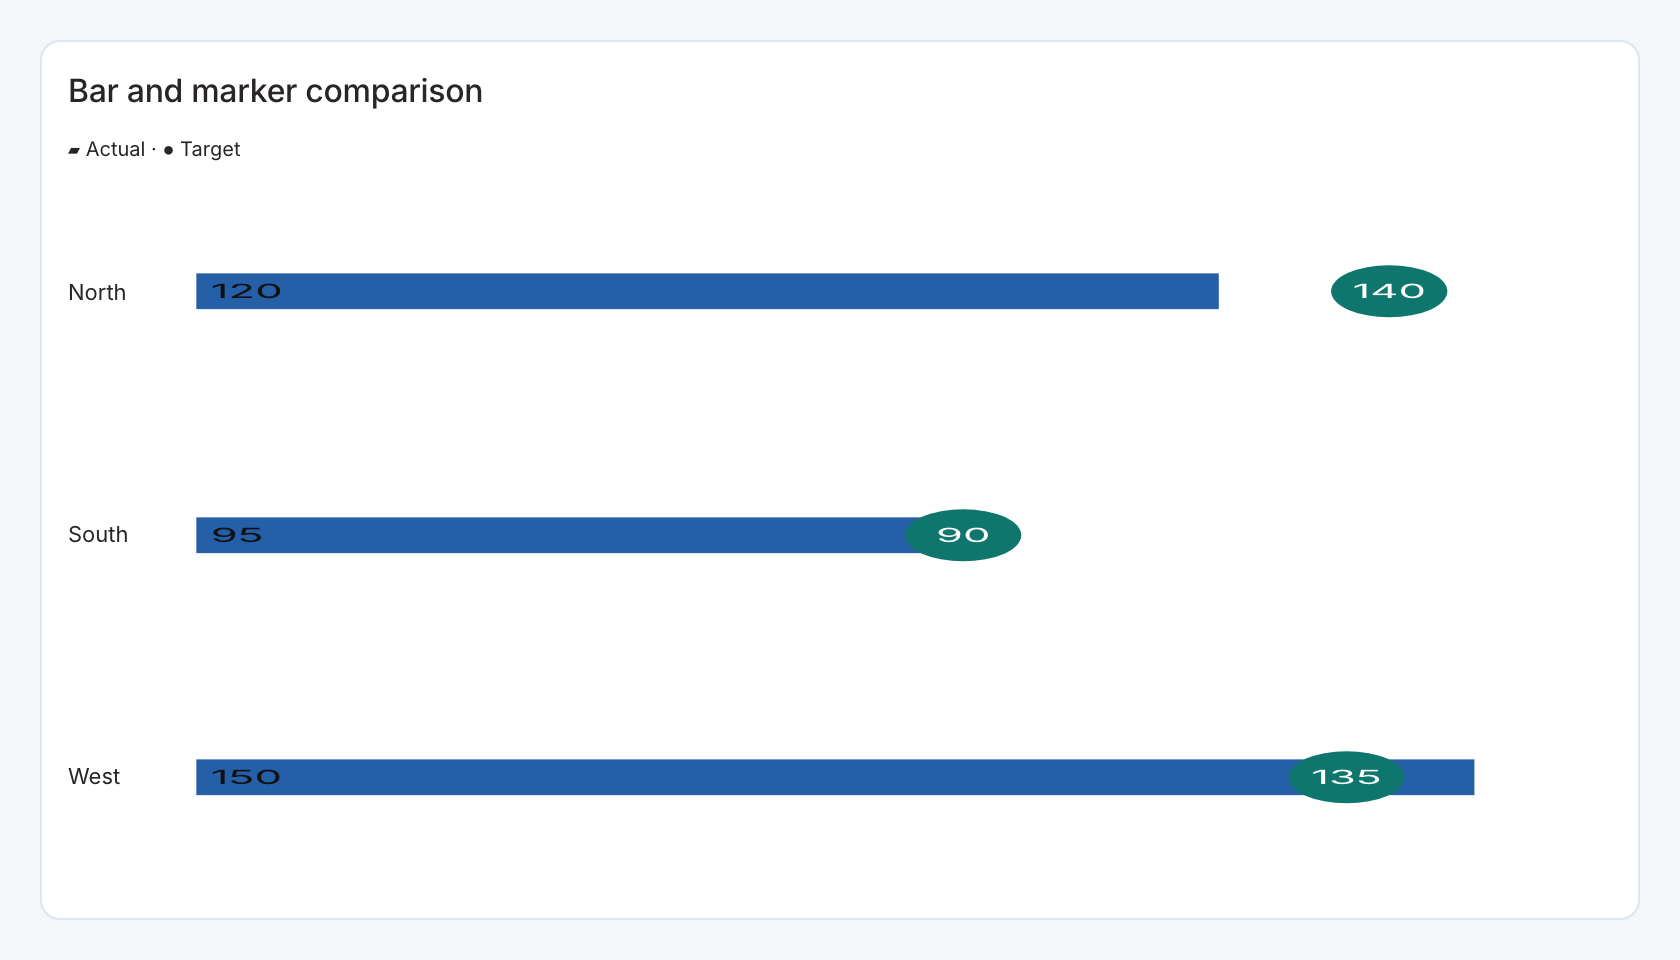
Required data and grain. One row per category with actual and target numeric values.
| Example field | Type | Role in this example |
|---|---|---|
category | Text | Required |
value | Number | Required |
target | Number | Required |
previous | Number | Optional / available to map |
sample | Number | Optional / available to map |
secondary | Number | Optional / available to map |
Optional fields and bindings. The label field is also the selection value in this view. Use distinct category labels when rows must select independently.
Example result.
category | value | target | previous | sample | secondary |
|---|---|---|---|---|---|
North | 120 | 140 | 105 | 80 | 18 |
South | 95 | 90 | 100 | 64 | 24 |
West | 150 | 135 | 130 | 92 | 12 |
Download the complete data example. Select this tile to load its preset settings, then use these column names in the visual builder or the example query.
Styling controls. Choose bar_marker style, actual/target labels, marker and bar colors, axis bounds, orientation and value formats.
Interactions. Select a category row or actionable mark to send its configured value to a linked action.
Check before publishing. Keep actual and target in the same units and explain whether larger or smaller is better.
Paired comparison
Specialized widget · Picker tile paired-values
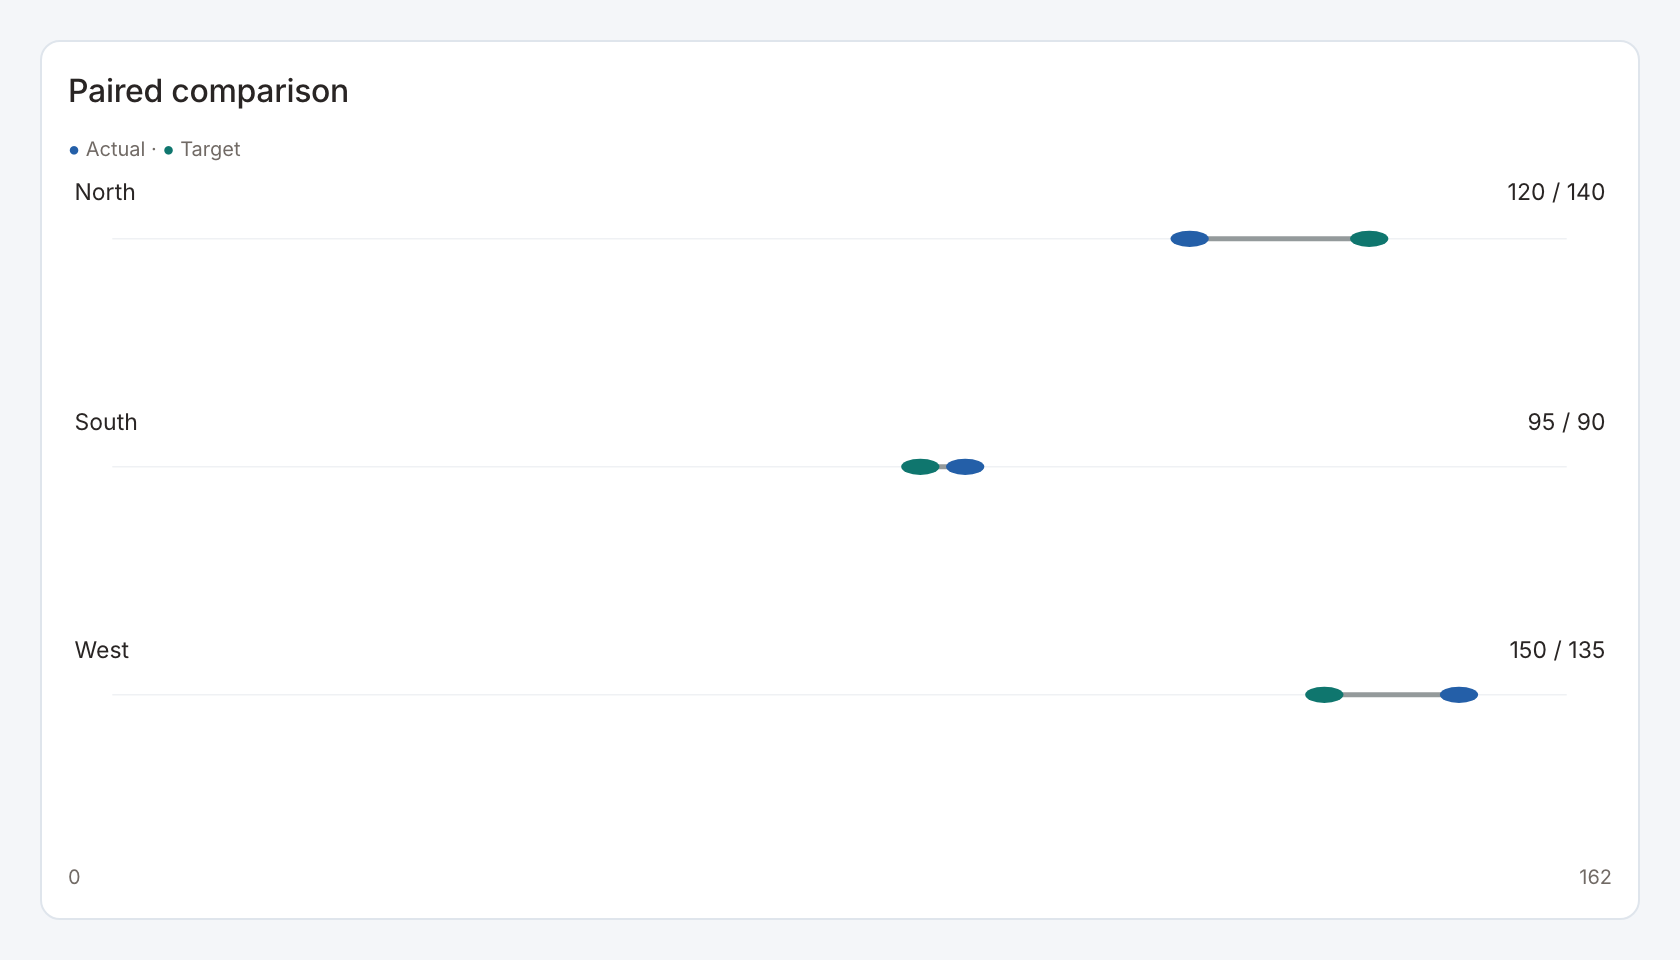
Required data and grain. One row per category with actual and target numeric values.
| Example field | Type | Role in this example |
|---|---|---|
category | Text | Required |
value | Number | Required |
target | Number | Required |
previous | Number | Optional / available to map |
sample | Number | Optional / available to map |
secondary | Number | Optional / available to map |
Optional fields and bindings. The label field is also the selection value in this view. Use distinct category labels when rows must select independently.
Example result.
category | value | target | previous | sample | secondary |
|---|---|---|---|---|---|
North | 120 | 140 | 105 | 80 | 18 |
South | 95 | 90 | 100 | 64 | 24 |
West | 150 | 135 | 130 | 92 | 12 |
Download the complete data example. Select this tile to load its preset settings, then use these column names in the visual builder or the example query.
Styling controls. Choose paired comparison style, actual/target labels, marker and bar colors, axis bounds, orientation and value formats.
Interactions. Select a category row or actionable mark to send its configured value to a linked action.
Check before publishing. Keep actual and target in the same units and explain whether larger or smaller is better.
Profile breakdown
Specialized widget · Picker tile profile-breakdown
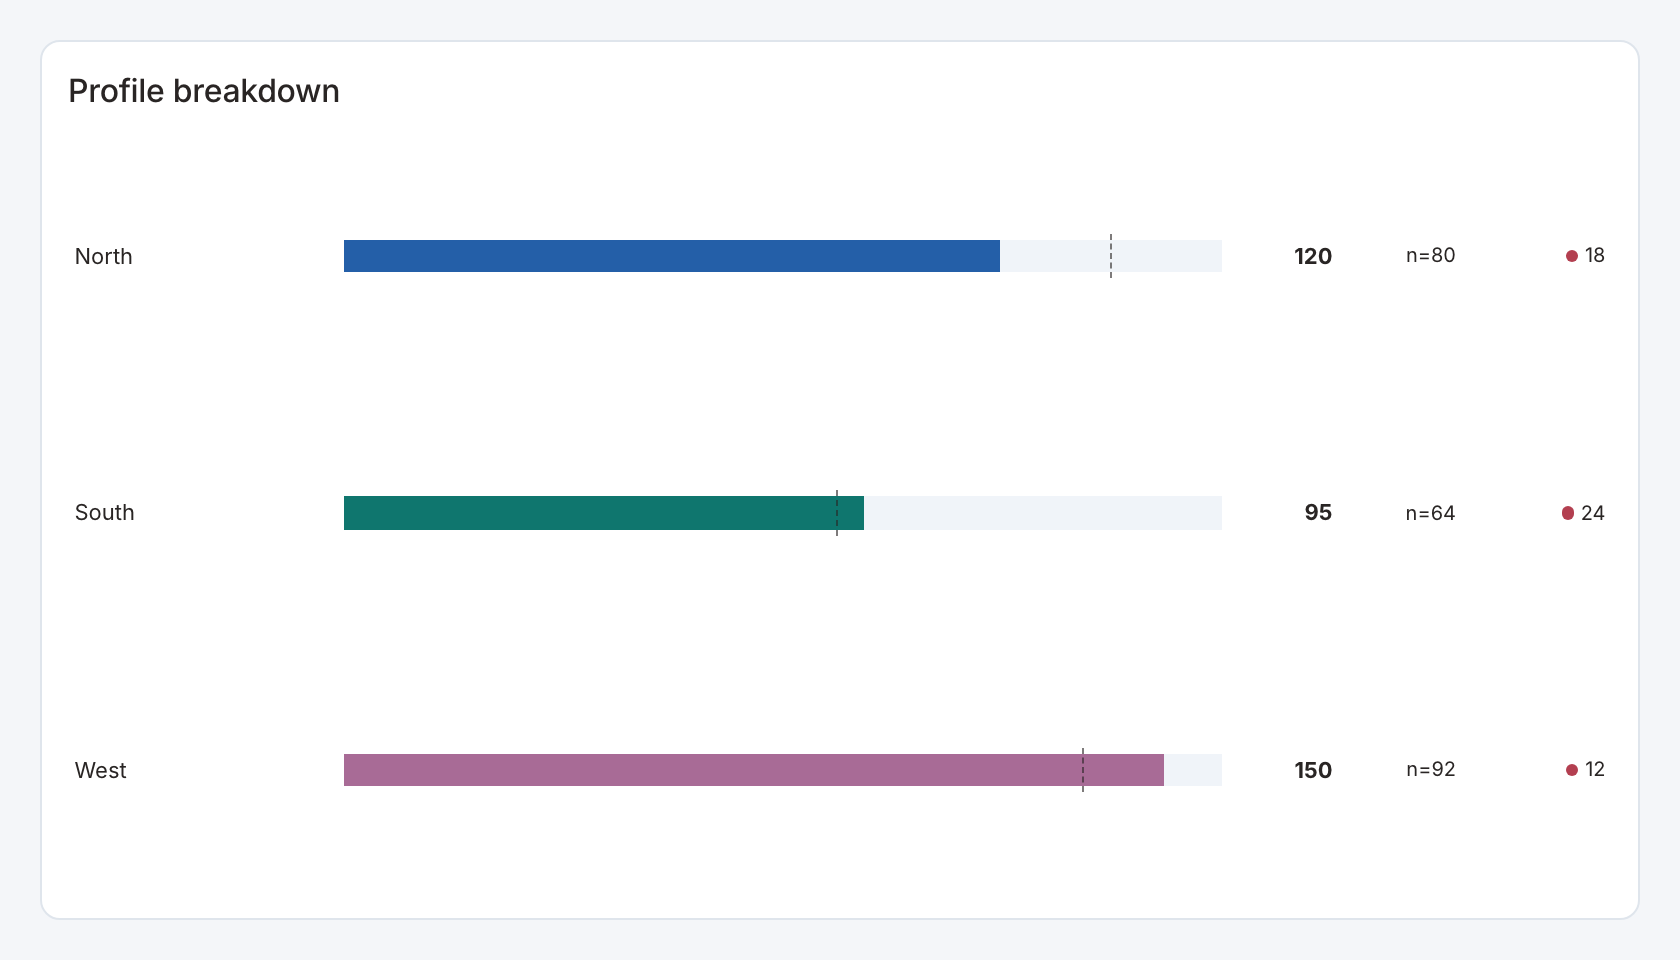
Required data and grain. One row per category and numeric main measure.
| Example field | Type | Role in this example |
|---|---|---|
category | Text | Required |
value | Number | Required |
target | Number | Optional / available to map |
previous | Number | Optional / available to map |
sample | Number | Optional / available to map |
secondary | Number | Optional / available to map |
Optional fields and bindings. sample adds counts, secondary adds another measure and target is the benchmark in the starter.
Example result.
category | value | target | previous | sample | secondary |
|---|---|---|---|---|---|
North | 120 | 140 | 105 | 80 | 18 |
South | 95 | 90 | 100 | 64 | 24 |
West | 150 | 135 | 130 | 92 | 12 |
Download the complete data example. Select this tile to load its preset settings, then use these column names in the visual builder or the example query.
Styling controls. Profile controls set sample/secondary/benchmark bindings, sample visibility, category colors, ordering, axis bounds and formats.
Interactions. Select a category row to send its configured value to a linked action.
Check before publishing. Explain the denominator for rates and keep sample counts visible when they help users judge small groups.
Share donut
Specialized widget · Picker tile share-donut
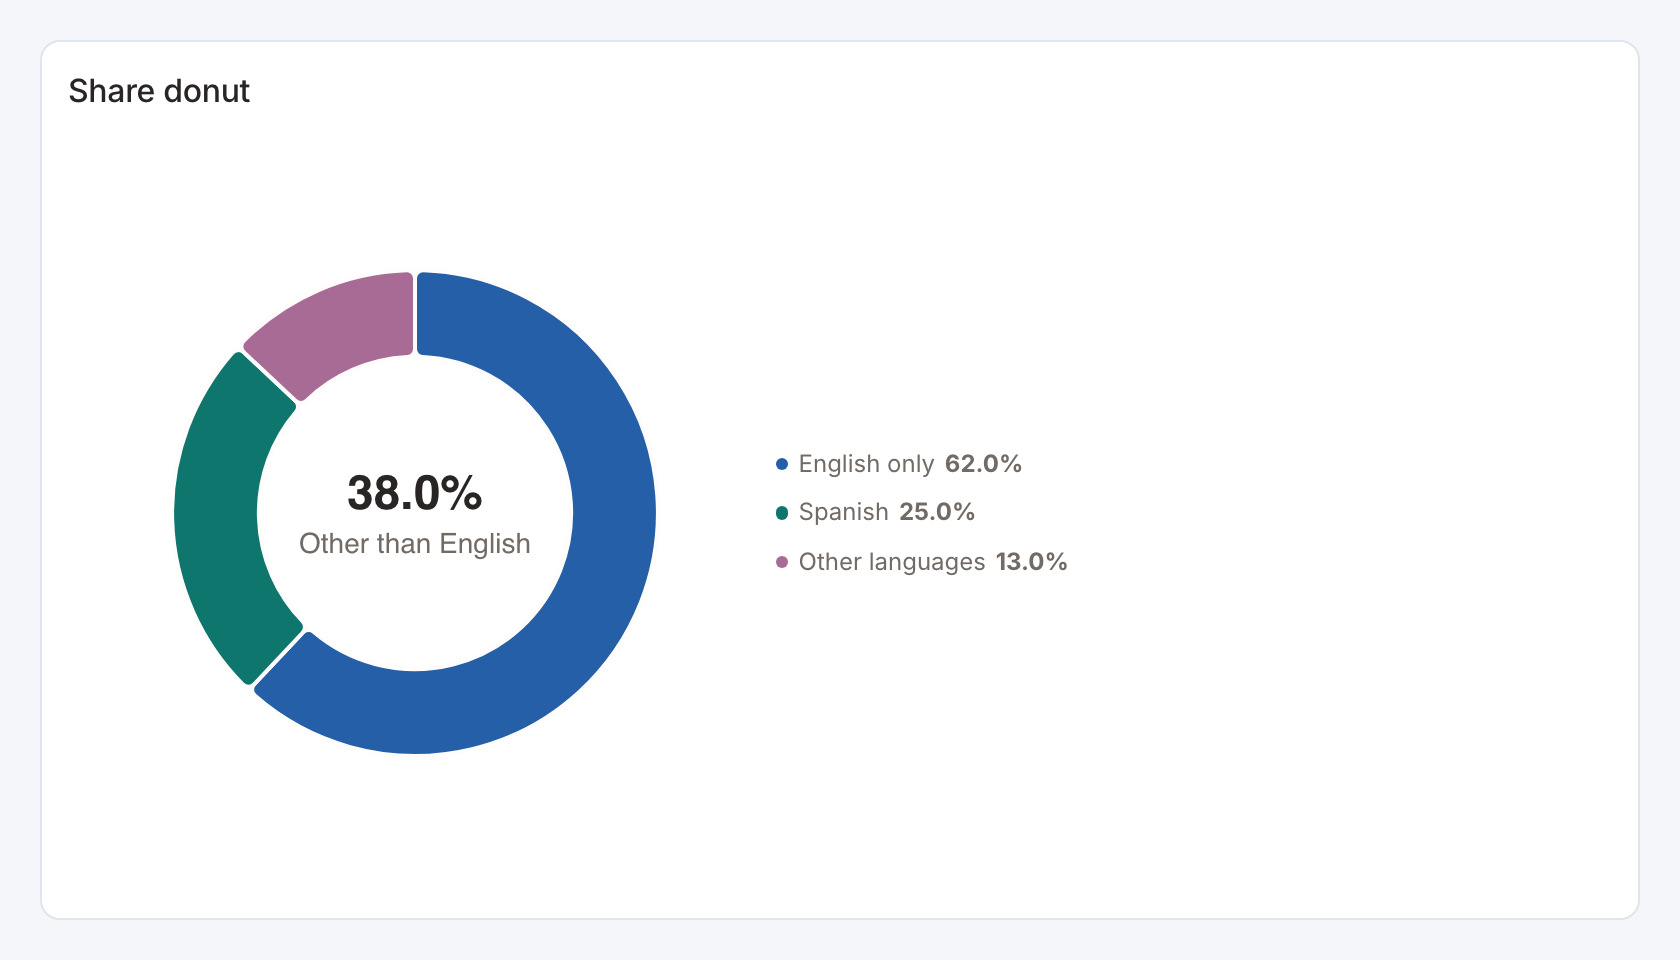
Required data and grain. One row per category and nonnegative magnitude.
| Example field | Type | Role in this example |
|---|---|---|
category | Text | Required |
value | Number | Required |
Optional fields and bindings. Choose the named category used for the center share.
Example result.
category | value |
|---|---|
English only | 62 |
Spanish | 25 |
Other languages | 13 |
Download the complete data example. Select this tile to load its preset settings, then use these column names in the visual builder or the example query.
Styling controls. Donut details choose center-share category, complement mode, center label, colors, legend and label formatting.
Interactions. Marks can send the selected category to a configured filter or drill-through action in view and presentation modes. Test the receiving widget with the same category and filter name.
Check before publishing. The starter highlights the complement of English only. If that category is absent after filtering, check the resulting center share before publishing.