Distributions and matrices
Statistical distributions, scatterplots, radar views and cell-based comparisons.
Open Add widget and choose the exact tile name below. Standard tiles use a base renderer. Specialized widget tiles preload that renderer’s specialized view, field mappings and starter data. Both are editable in Studio. Read the shared data, styling and interaction guide before replacing starter data.
Screenshots. These are real Studio widgets with fictional sample data and example settings. Colors, labels and layout remain configurable. Select an image to view it at full size.
Heatmap
Standard · Picker tile heatmap
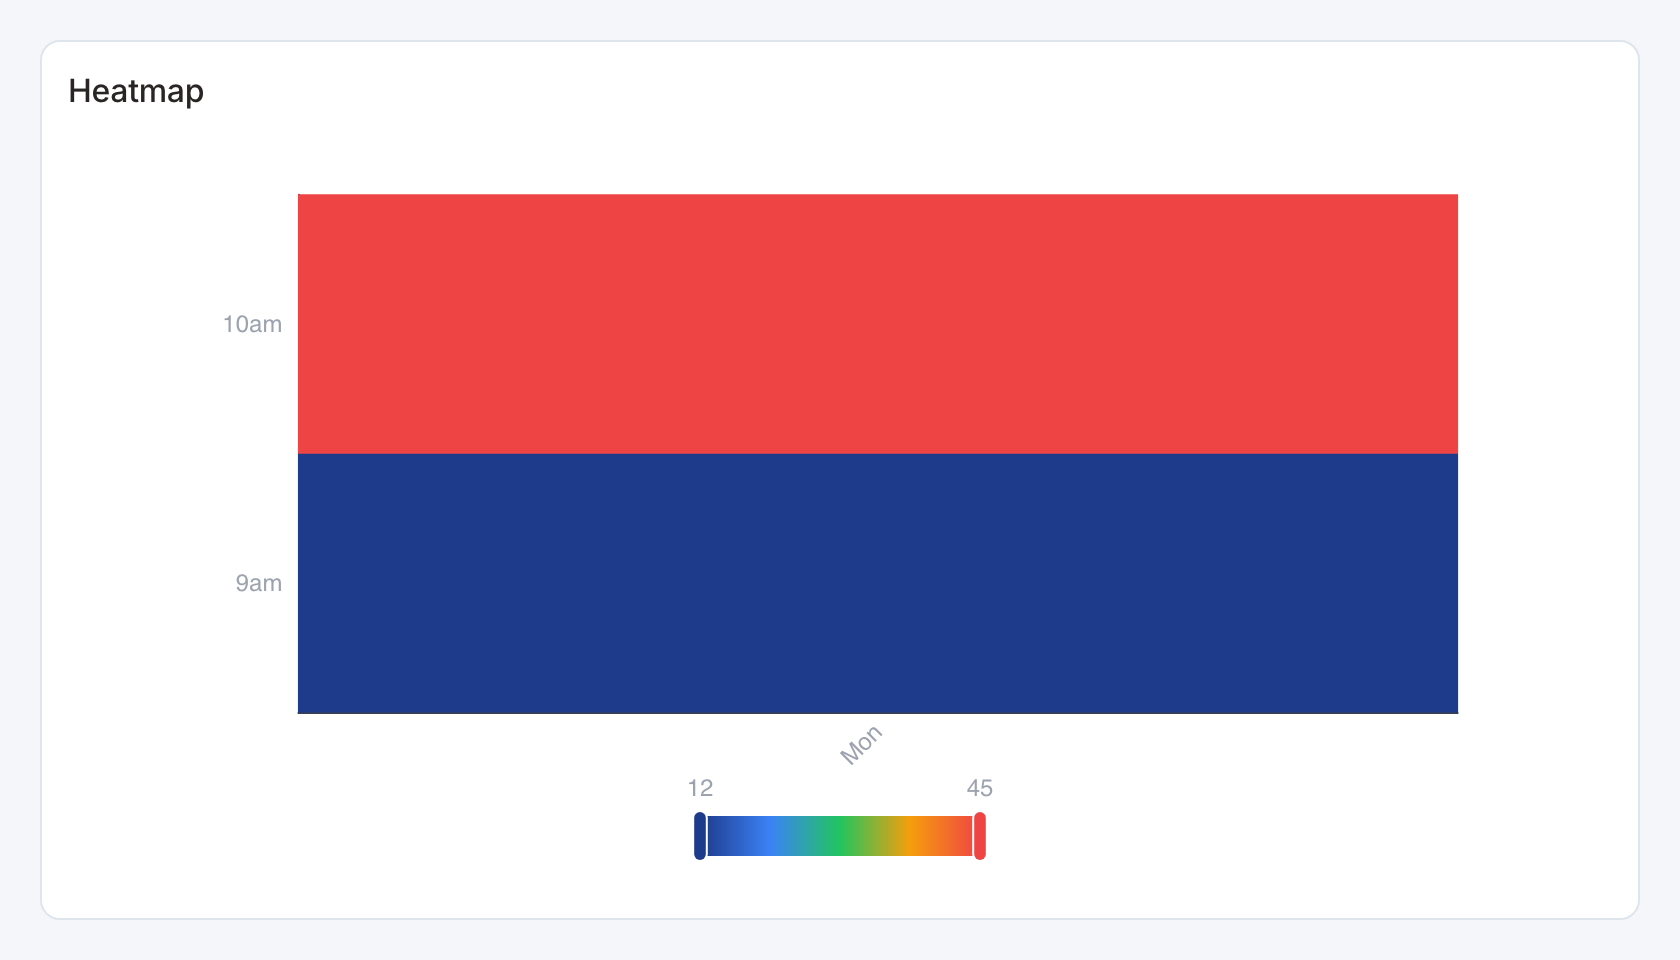
Required data and grain. Long form, one row per x/y cell. Columns are x category, y category and numeric value, in that order.
| Example field | Type | Role in this example |
|---|---|---|
day | Text | Required |
hour | Text | Required |
value | Number | Required |
Optional fields and bindings. Prepare repeated cells at the required grain in the source.
Example result.
day | hour | value |
|---|---|---|
Mon | 9am | 12 |
Mon | 10am | 45 |
Download the complete data example. Select this tile to load its preset settings, then use these column names in the visual builder or the example query.
Styling controls. Set palette, value labels, grid and axis labels. Enlarge the card when many rows or columns would squeeze labels.
Interactions. Hover for values where a tooltip is shown. This renderer does not send mark selections to dashboard filters or drill-through.
Check before publishing. Use Heatmap matrix for explicit cell selection, row totals and more detailed color-scale controls.
Scatter
Standard · Picker tile scatter_plot
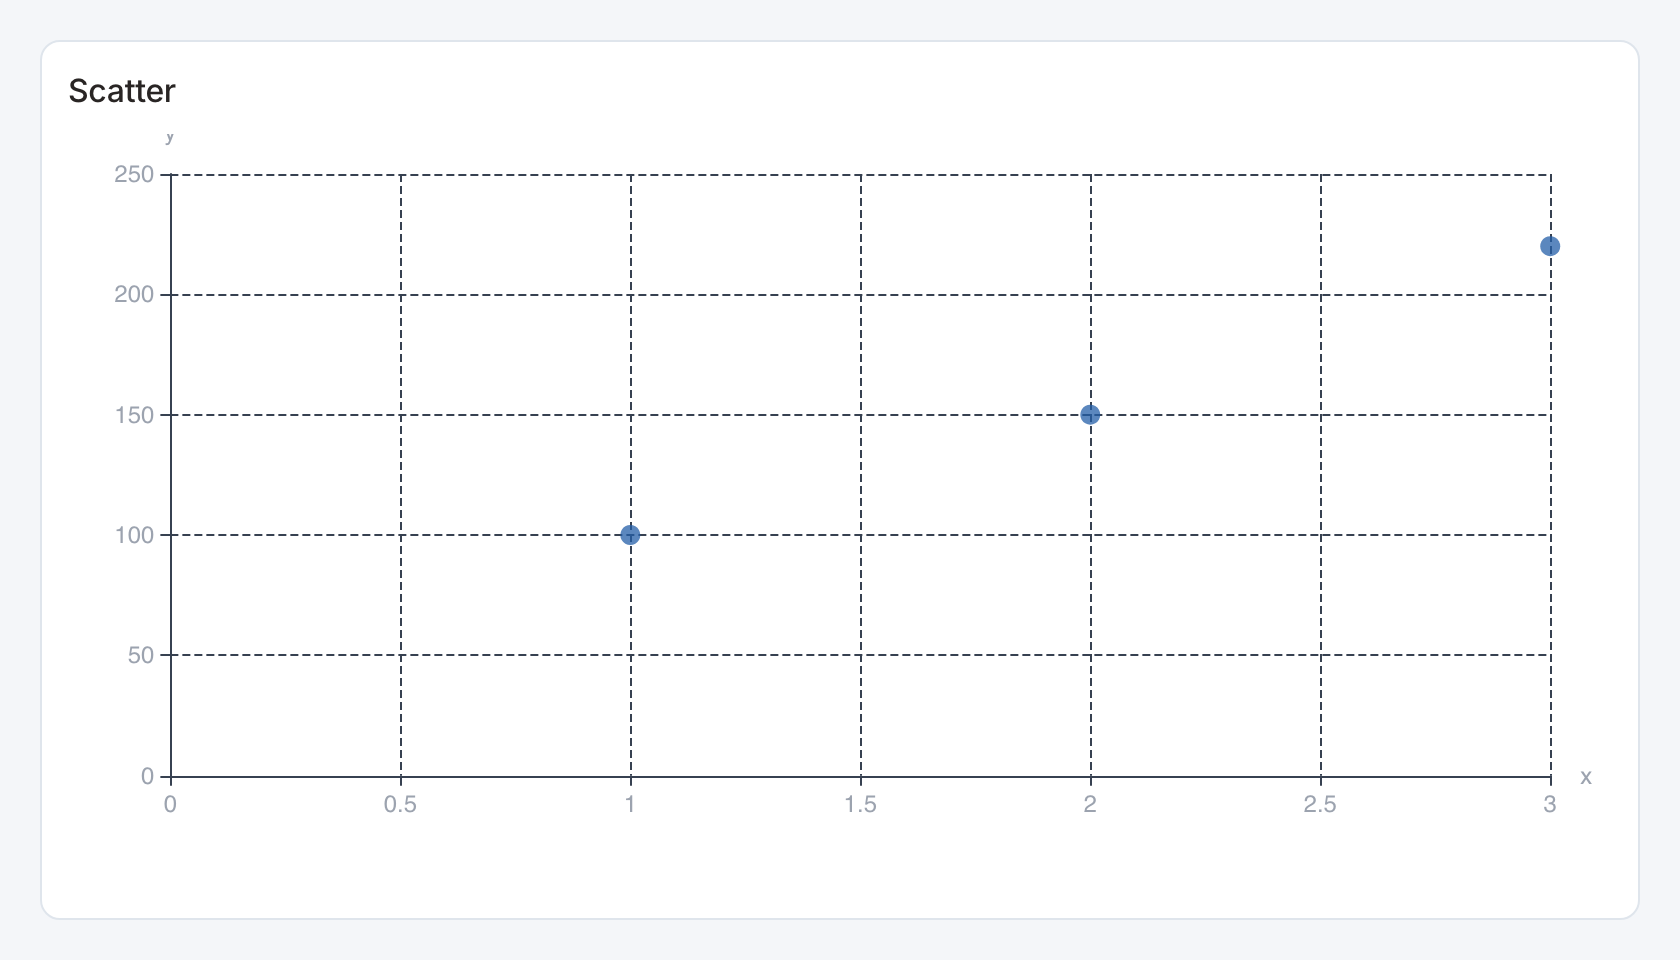
Required data and grain. One row per observation. Bind numeric x and y fields, or place them in the first two columns.
| Example field | Type | Role in this example |
|---|---|---|
x | Number | Required |
y | Number | Required |
Optional fields and bindings. Scatter bindings can add label, group and size columns. Use finite numeric values for both coordinates.
Example result.
x | y |
|---|---|
1 | 100 |
2 | 150 |
3 | 220 |
Download the complete data example. Select this tile to load its preset settings, then use these column names in the visual builder or the example query.
Styling controls. Scatter controls set mappings and marker appearance. Set palette, axes, labels, legend and value formats.
Interactions. Hover for values where a tooltip is shown. This renderer does not send mark selections to dashboard filters or drill-through.
Check before publishing. Use Metric bubbles when viewers need metric selectors, top-N controls or linked point selection.
Radar
Standard · Picker tile radar
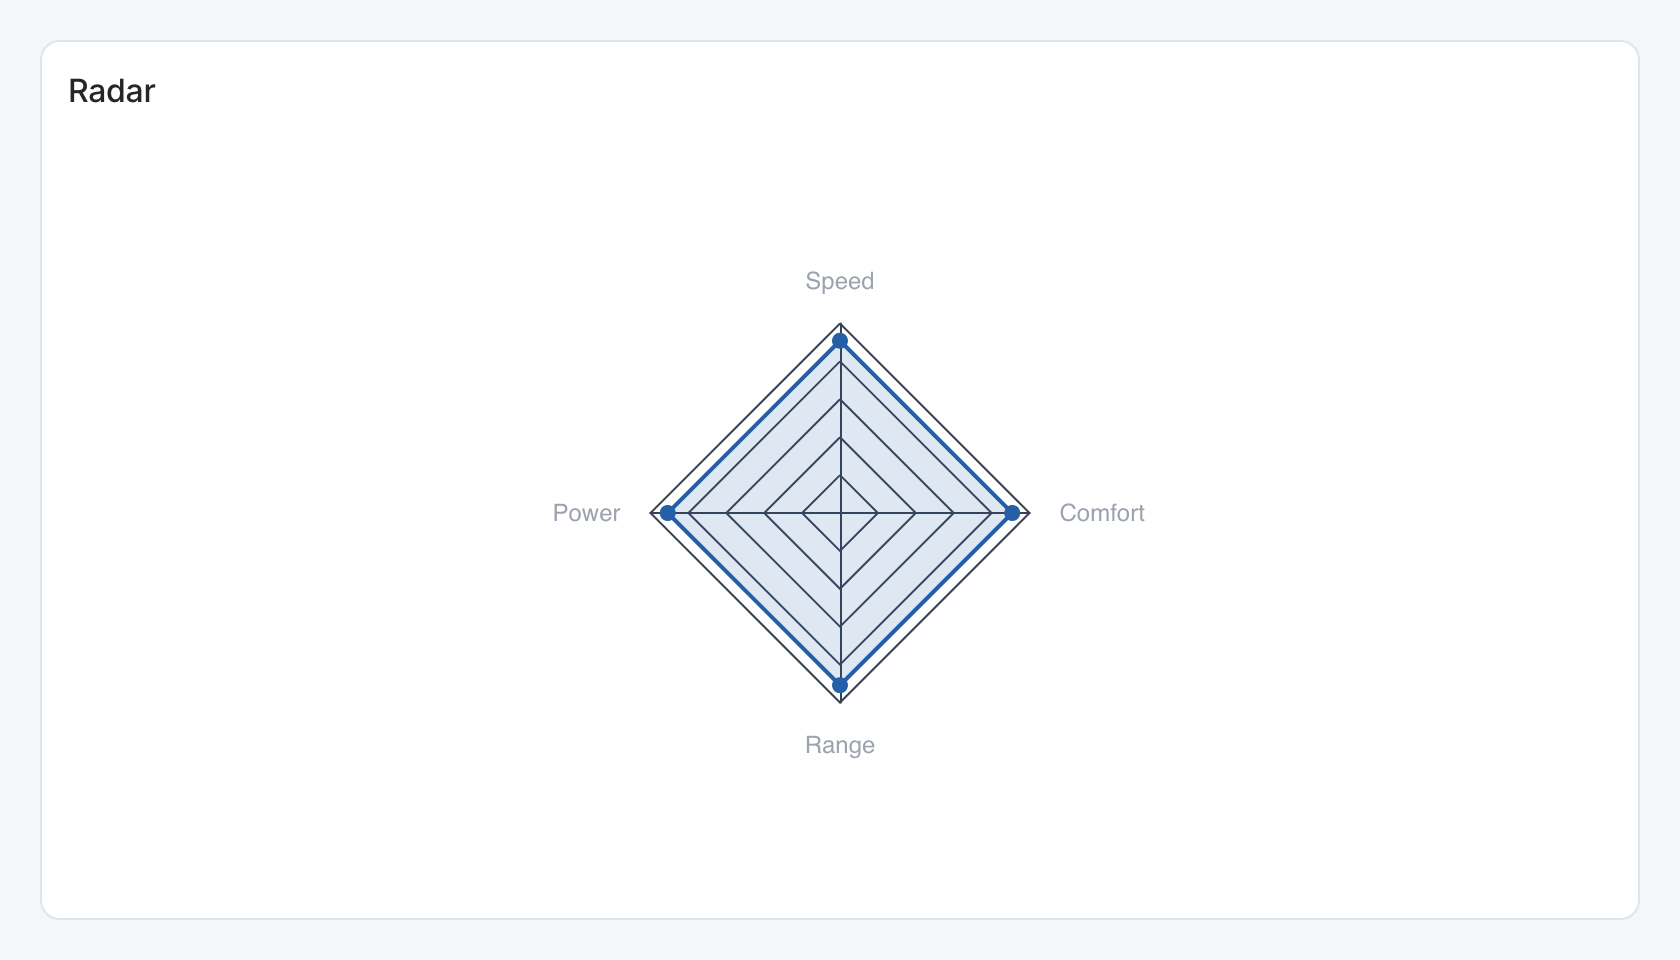
Required data and grain. One row per indicator with numeric value. Columns are indicator label, value and optionally series label.
| Example field | Type | Role in this example |
|---|---|---|
axis | Text | Required |
value | Number | Required |
Optional fields and bindings. The optional third column creates comparison series across the same indicators.
Example result — first three rows.
axis | value |
|---|---|
Speed | 80 |
Power | 70 |
Range | 90 |
Download the complete data example. Select this tile to load its preset settings, then use these column names in the visual builder or the example query.
Styling controls. Set colors, legend and indicator labels. Use comparable scales across spokes.
Interactions. Hover for values where a tooltip is shown. This renderer does not send mark selections to dashboard filters or drill-through.
Check before publishing. Comparison radar adds explicit actual/target bindings and selectable category controls.
Boxplot
Standard · Picker tile boxplot
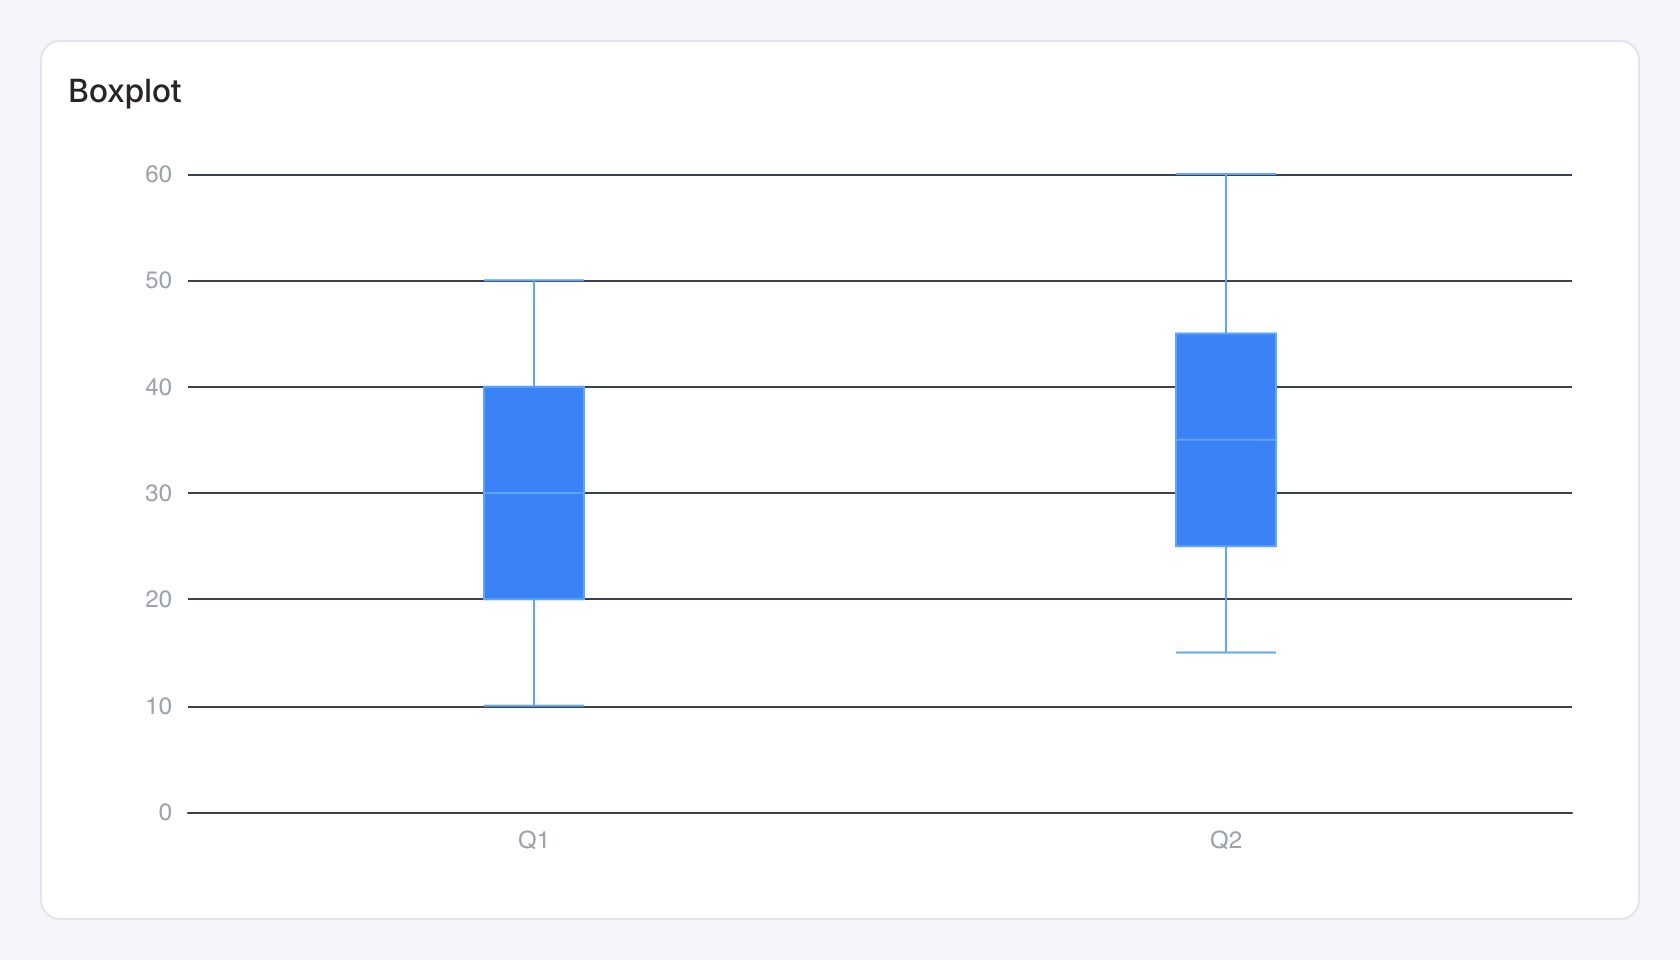
Required data and grain. One row per category with precomputed statistics in order.
| Example field | Type | Role in this example |
|---|---|---|
category | Text | Required |
min | Number | Required |
q1 | Number | Required |
median | Number | Required |
q3 | Number | Required |
max | Number | Required |
Optional fields and bindings. The five numeric fields are minimum, first quartile, median, third quartile and maximum.
Example result.
category | min | q1 | median | q3 | max |
|---|---|---|---|---|---|
Q1 | 10 | 20 | 30 | 40 | 50 |
Q2 | 15 | 25 | 35 | 45 | 60 |
Download the complete data example. Select this tile to load its preset settings, then use these column names in the visual builder or the example query.
Styling controls. Set palette, axes, labels and plot orientation where available.
Interactions. Hover a box to inspect the statistics. For raw observations and selectable groups use Grouped box plot.
Check before publishing. Check min ≤ q1 ≤ median ≤ q3 ≤ max. This tile does not compute quartiles from a raw observation column.
Parallel
Standard · Picker tile parallel
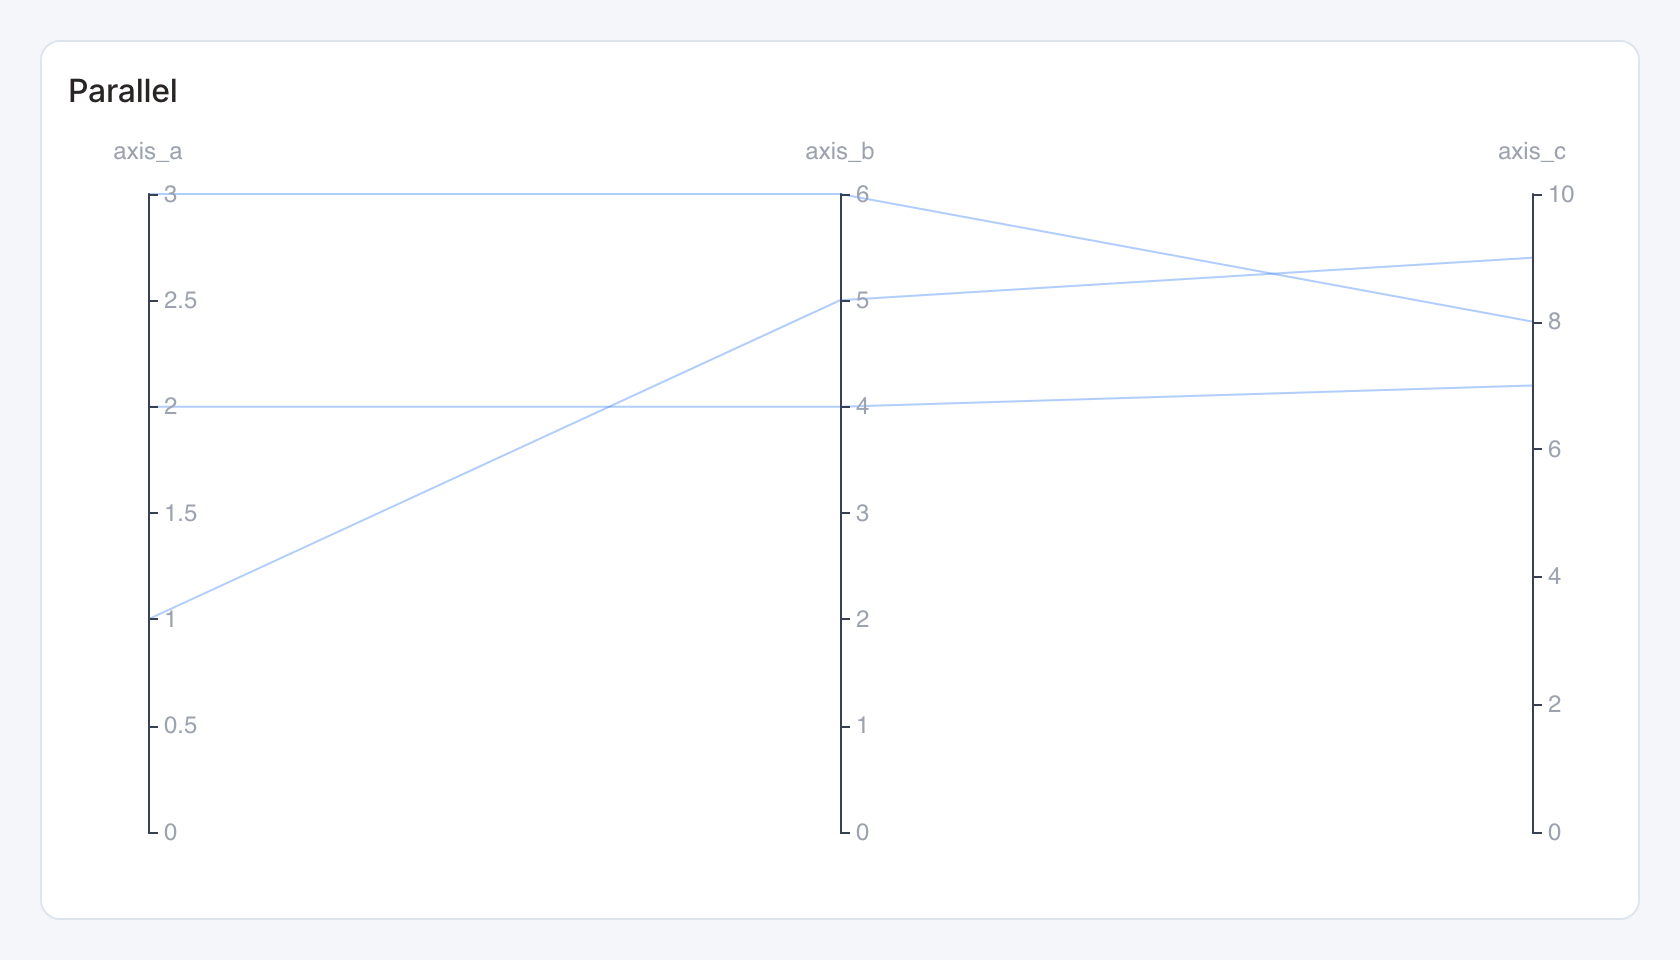
Required data and grain. One row per observation, with multiple numeric dimension columns. Each column becomes an axis.
| Example field | Type | Role in this example |
|---|---|---|
axis_a | Number | Required |
axis_b | Number | Required |
axis_c | Number | Required |
Optional fields and bindings. Add further numeric dimensions as needed. Prepare comparable scales or normalize in the source.
Example result.
axis_a | axis_b | axis_c |
|---|---|---|
1 | 5 | 9 |
3 | 6 | 8 |
2 | 4 | 7 |
Download the complete data example. Select this tile to load its preset settings, then use these column names in the visual builder or the example query.
Styling controls. Set line colors and axis labels. Use enough width to separate dimension axes.
Interactions. Hover for values where a tooltip is shown. This renderer does not send mark selections to dashboard filters or drill-through.
Check before publishing. A record is a polyline across dimensions. Nonnumeric descriptive columns are not numeric dimensions.
Histogram
Standard · Picker tile histogram
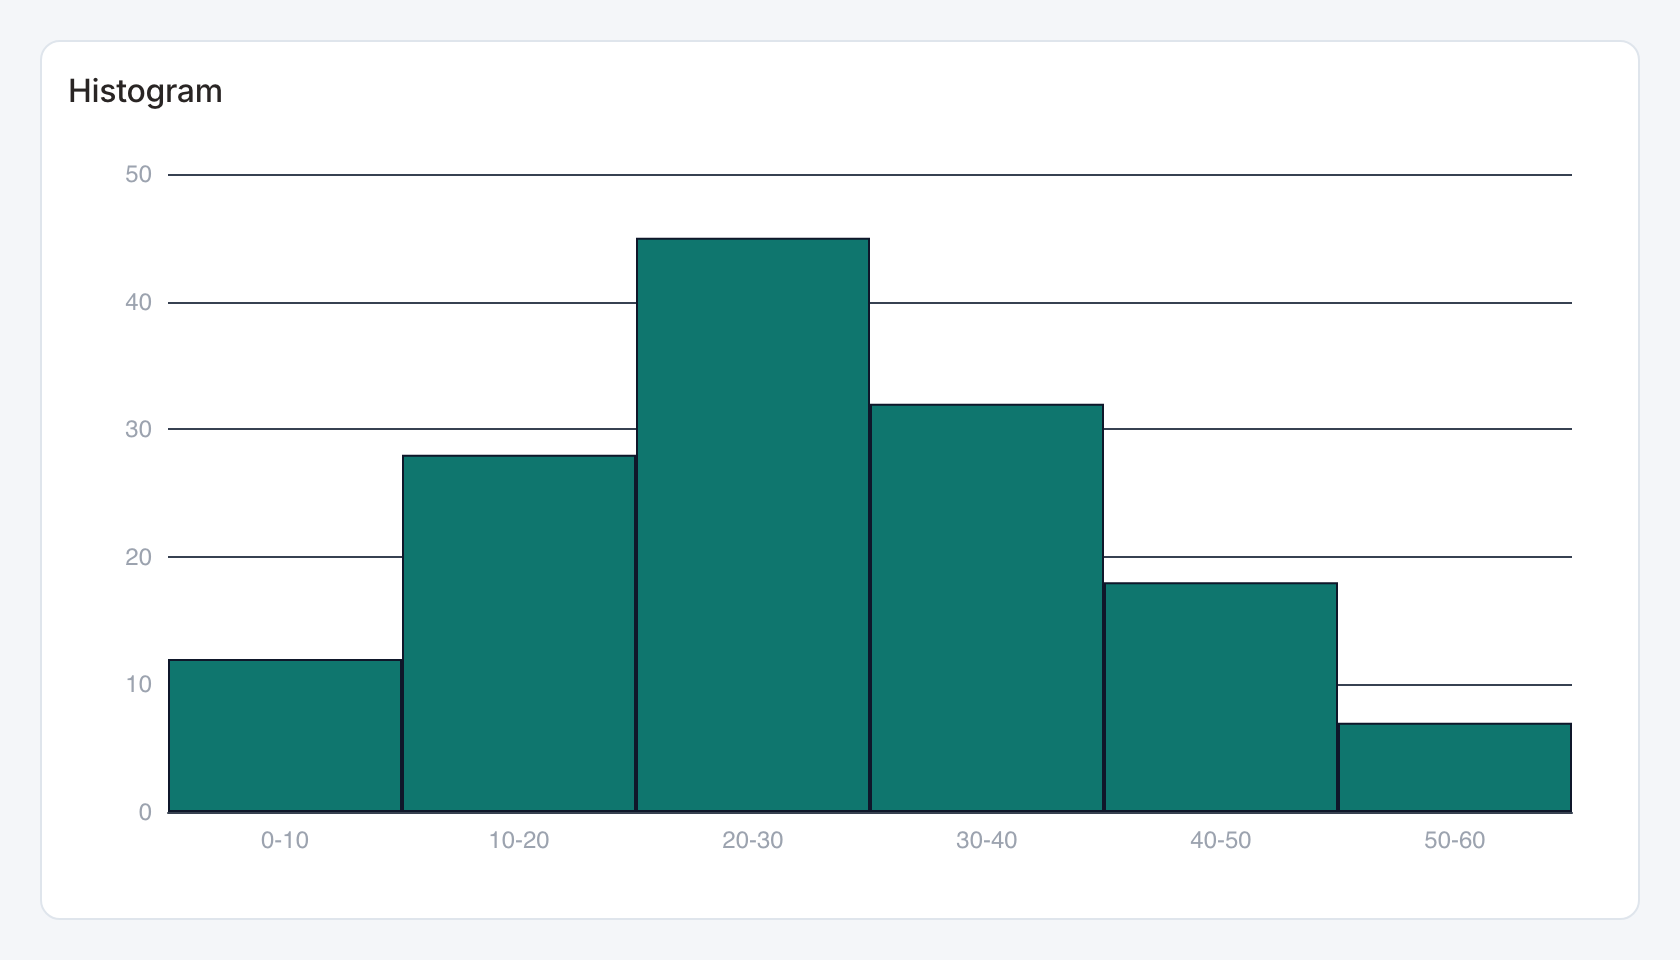
Required data and grain. Use one numeric observation column, or two columns containing a precomputed bucket label and count.
| Example field | Type | Role in this example |
|---|---|---|
bucket | Text | Required |
count | Number | Required |
Optional fields and bindings. The example is already binned. For raw observations, return a single numeric column.
Example result — first three rows.
bucket | count |
|---|---|
0-10 | 12 |
10-20 | 28 |
20-30 | 45 |
Download the complete data example. Select this tile to load its preset settings, then use these column names in the visual builder or the example query.
Styling controls. Set palette, axis labels, grid and numeric format.
Interactions. Hover bins to inspect values. This renderer does not send bin selections to dashboard filters.
Check before publishing. Use Weighted distribution for an explicit weight column and bin-size controls. Do not mix raw values and already-counted bins.
Packed Bubbles
Standard · Picker tile packed_bubbles
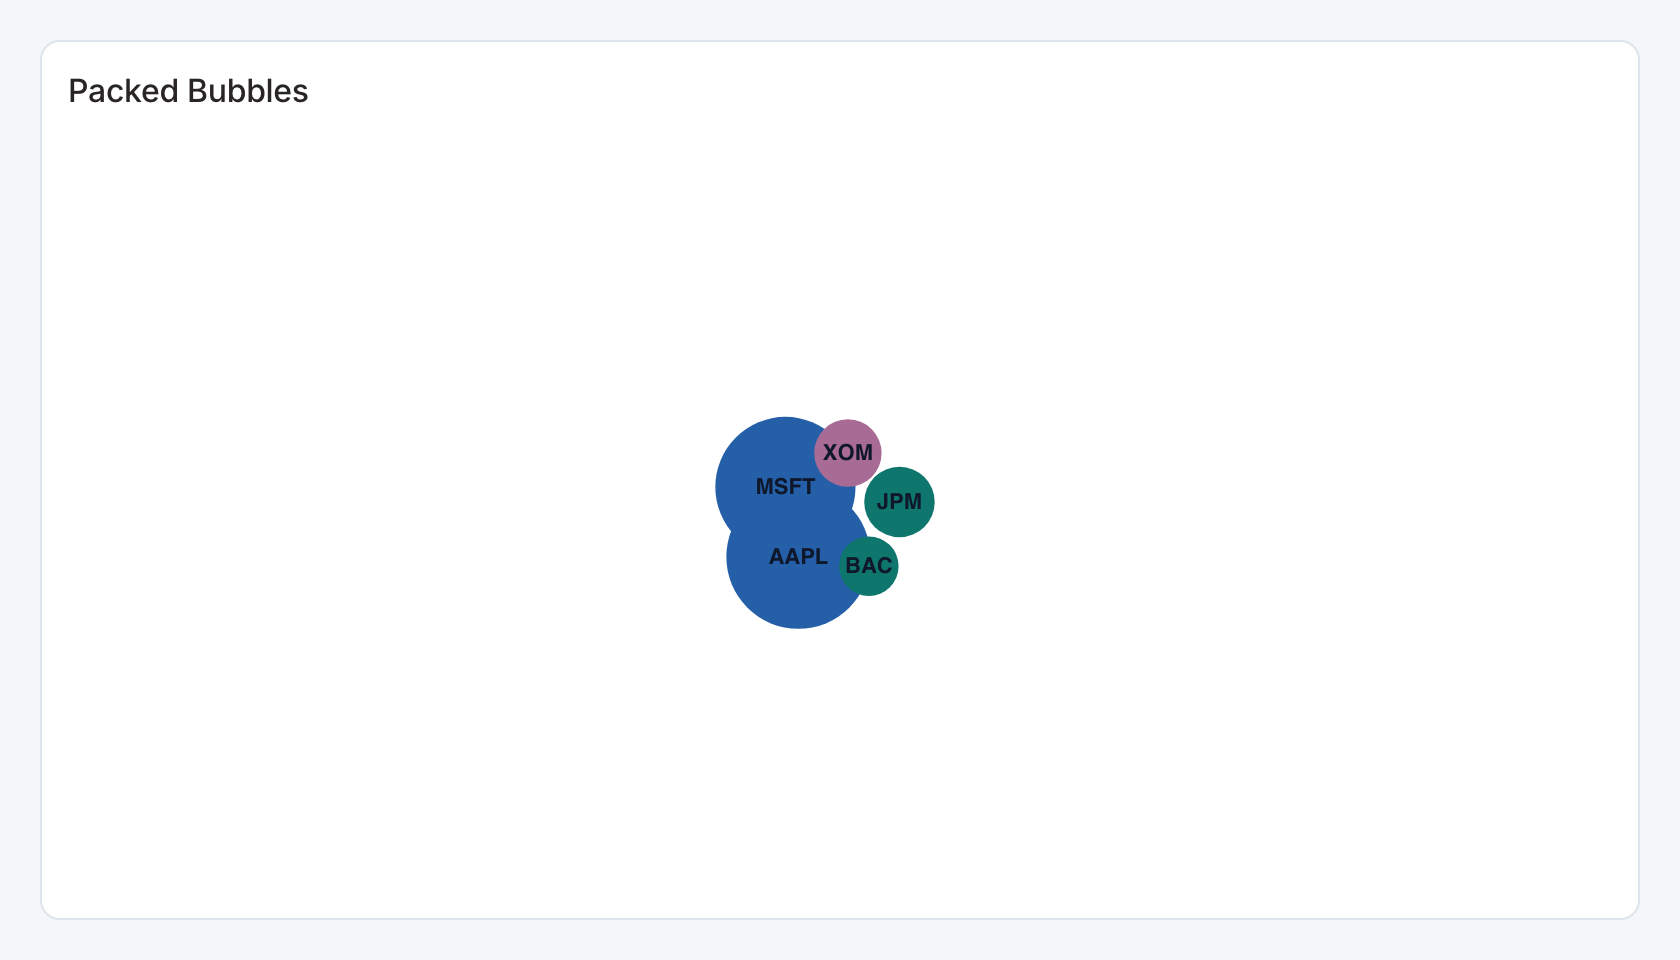
Required data and grain. One row per bubble. First column is label and second nonnegative numeric size.
| Example field | Type | Role in this example |
|---|---|---|
label | Text | Required |
value | Number | Required |
category | Text | Optional / available to map |
Optional fields and bindings. An optional third category column groups bubbles.
Example result — first three rows.
label | value | category |
|---|---|---|
AAPL | 3200 | Tech |
MSFT | 3000 | Tech |
JPM | 480 | Finance |
Download the complete data example. Select this tile to load its preset settings, then use these column names in the visual builder or the example query.
Styling controls. Set palette, group colors, labels and value format. Enlarge the card when many bubbles compete for room.
Interactions. Marks can send the selected category to a configured filter or drill-through action in view and presentation modes. Test the receiving widget with the same category and filter name.
Check before publishing. Bubble area is a visual encoding. Use the tooltip or data table for exact comparisons.
Grouped box plot
Specialized widget · Picker tile observation-boxplot
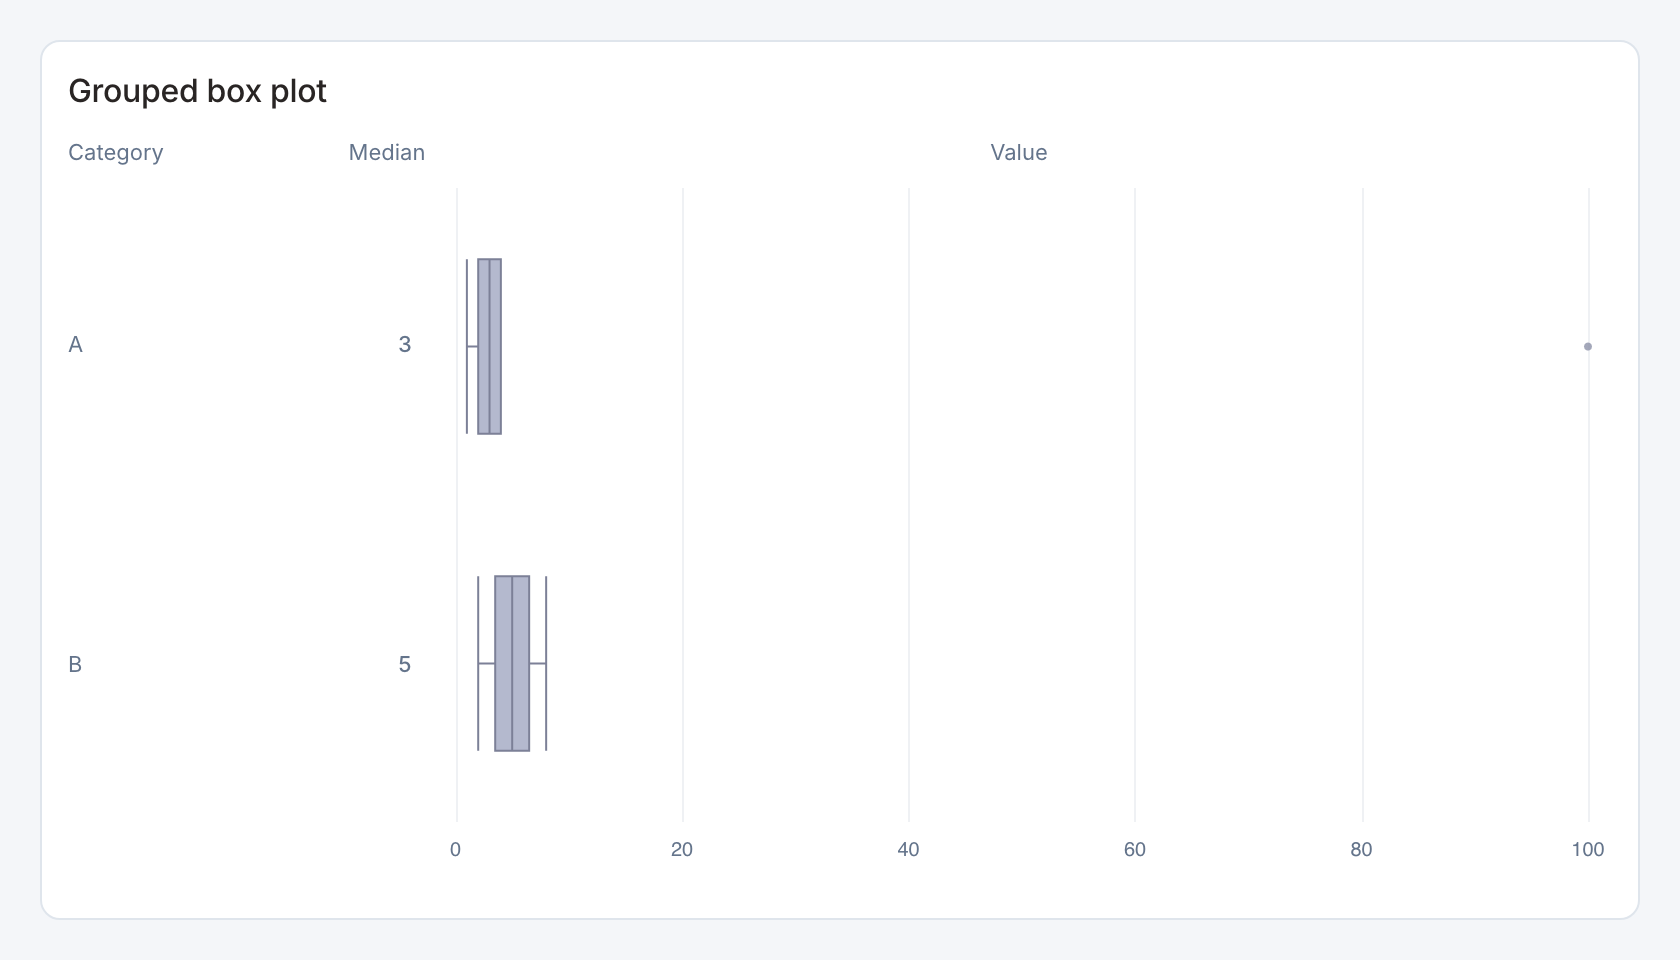
Required data and grain. One row per raw numeric observation, with a category for grouping.
| Example field | Type | Role in this example |
|---|---|---|
category | Text | Required |
value | Number | Required |
Optional fields and bindings. Optional selection keys can map groups to a dashboard action.
Example result — first three rows.
category | value |
|---|---|
A | 1 |
A | 2 |
A | 3 |
Download the complete data example. Select this tile to load its preset settings, then use these column names in the visual builder or the example query.
Styling controls. Boxplot controls choose observation mode, field bindings, orientation, Tukey or extent whiskers, median visibility, ordering, colors and value format.
Interactions. Hover statistics and outliers. Select a group to send its configured selection value to a filter or drill-through action.
Check before publishing. This preset computes quartiles from the returned observations. Preserve the raw distribution rather than passing precomputed quartiles.
Weighted distribution
Specialized widget · Picker tile weighted-distribution
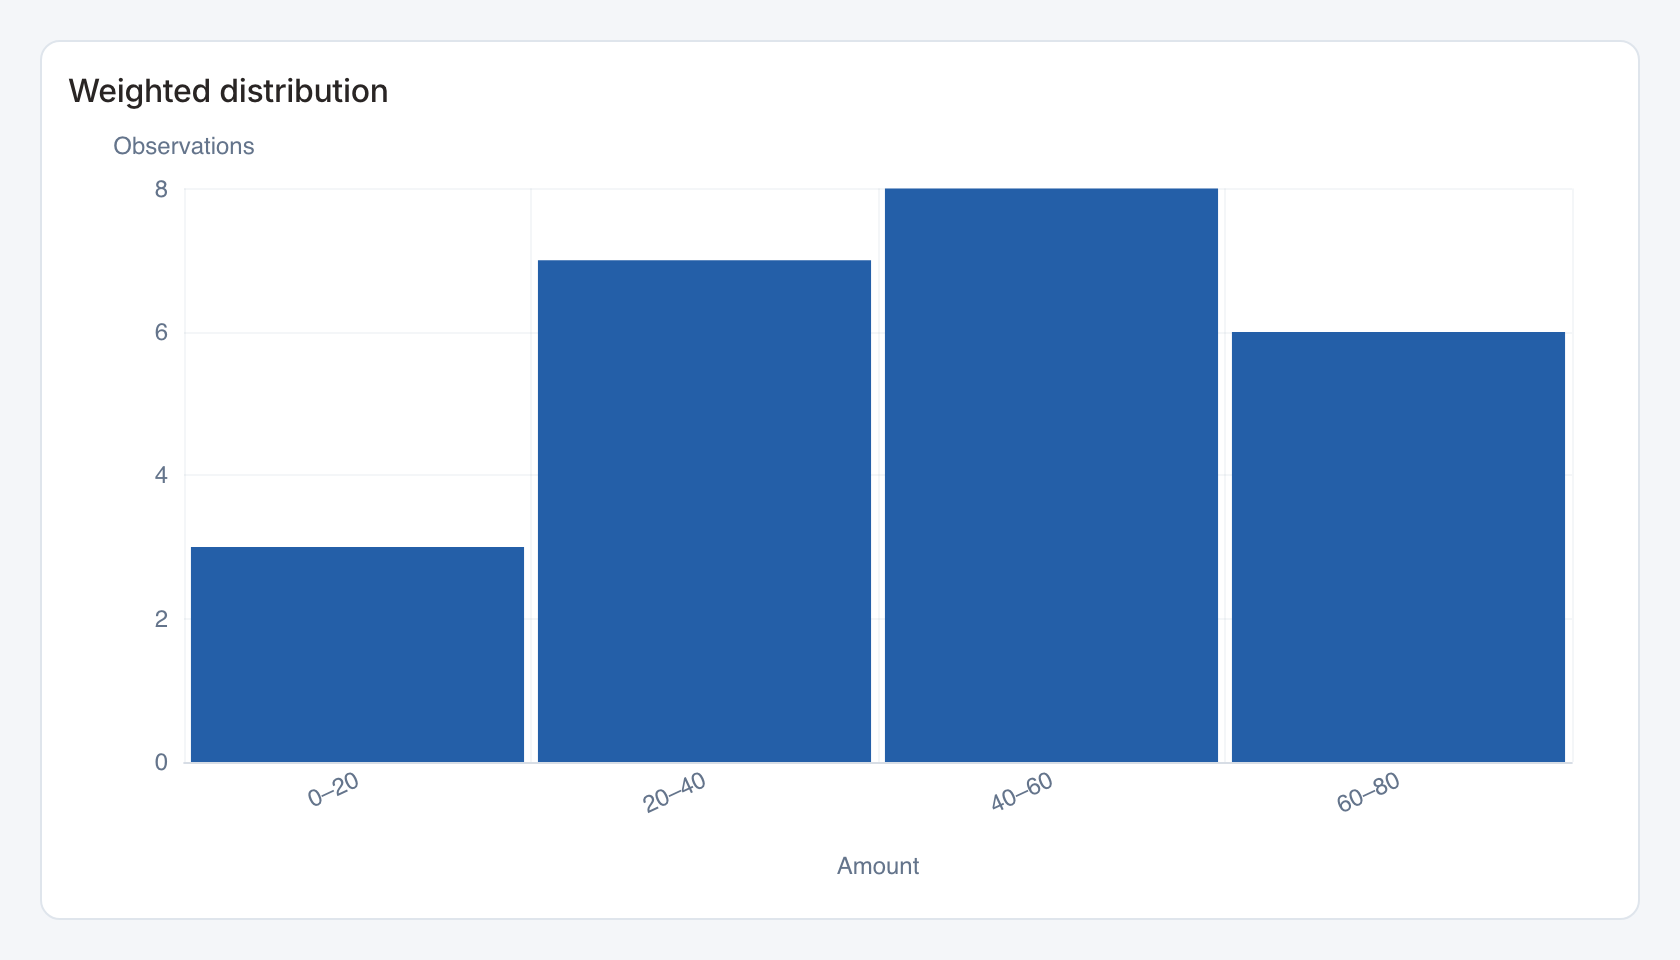
Required data and grain. One row per observed numeric amount and optional frequency weight.
| Example field | Type | Role in this example |
|---|---|---|
amount | Number | Required |
weight | Number | Required |
Optional fields and bindings. Map a weight only when each row represents multiple observations. Without weights, use raw observations.
Example result — first three rows.
amount | weight |
|---|---|
10 | 3 |
22 | 5 |
28 | 2 |
Download the complete data example. Select this tile to load its preset settings, then use these column names in the visual builder or the example query.
Styling controls. Distribution controls choose value and weight columns, bin size, axis labels, colors and format.
Interactions. Hover bins to inspect aggregated weight. A plot click can send the displayed bin label. It does not automatically generate a numeric range condition. Use an explicit matching bin category in the receiving dataset before enabling a linked action.
Check before publishing. The starter weight is required by its mapping. Choose bin widths appropriate to the measure and do not double-count already-aggregated frequencies.
Metric bubbles
Specialized widget · Picker tile metric-bubbles
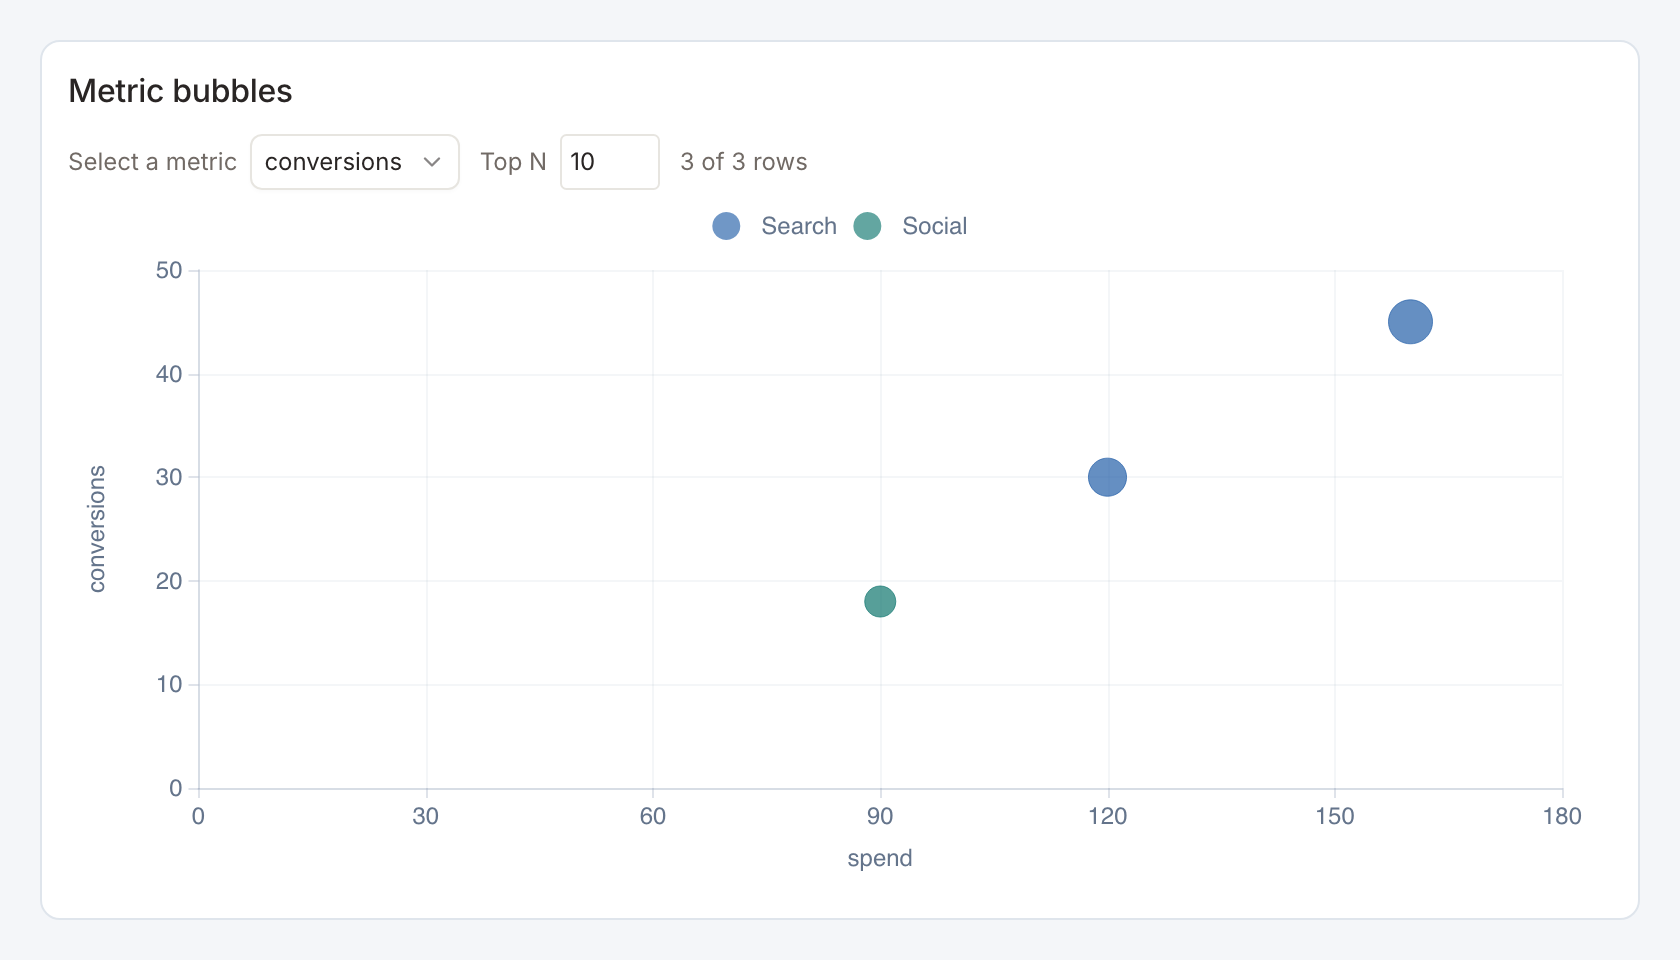
Required data and grain. One row per item, with numeric x, y and bubble-size values.
| Example field | Type | Role in this example |
|---|---|---|
name | Text | Required |
segment | Text | Optional / available to map |
spend | Number | Required |
conversions | Number | Required |
revenue | Number | Optional / available to map |
audience | Number | Required |
Optional fields and bindings. segment groups colors. revenue is an alternative y metric in the starter selector.
Example result.
name | segment | spend | conversions | revenue | audience |
|---|---|---|---|---|---|
North | Search | 120 | 30 | 800 | 90 |
South | Social | 90 | 18 | 450 | 60 |
West | Search | 160 | 45 | 1250 | 120 |
Download the complete data example. Select this tile to load its preset settings, then use these column names in the visual builder or the example query.
Styling controls. Bind labels, groups, axes and size. Enable metric and top-N selectors, choose candidate metrics, axis formats, colors and marker scaling.
Interactions. Select a bubble for a configured item action. Metric and top-N selectors change the visible comparison without editing SQL.
Check before publishing. Top-N limits the displayed subset. It does not imply that the data source query has returned every candidate.
Calendar metric scatterplot
Specialized widget · Picker tile calendar-metric-scatter
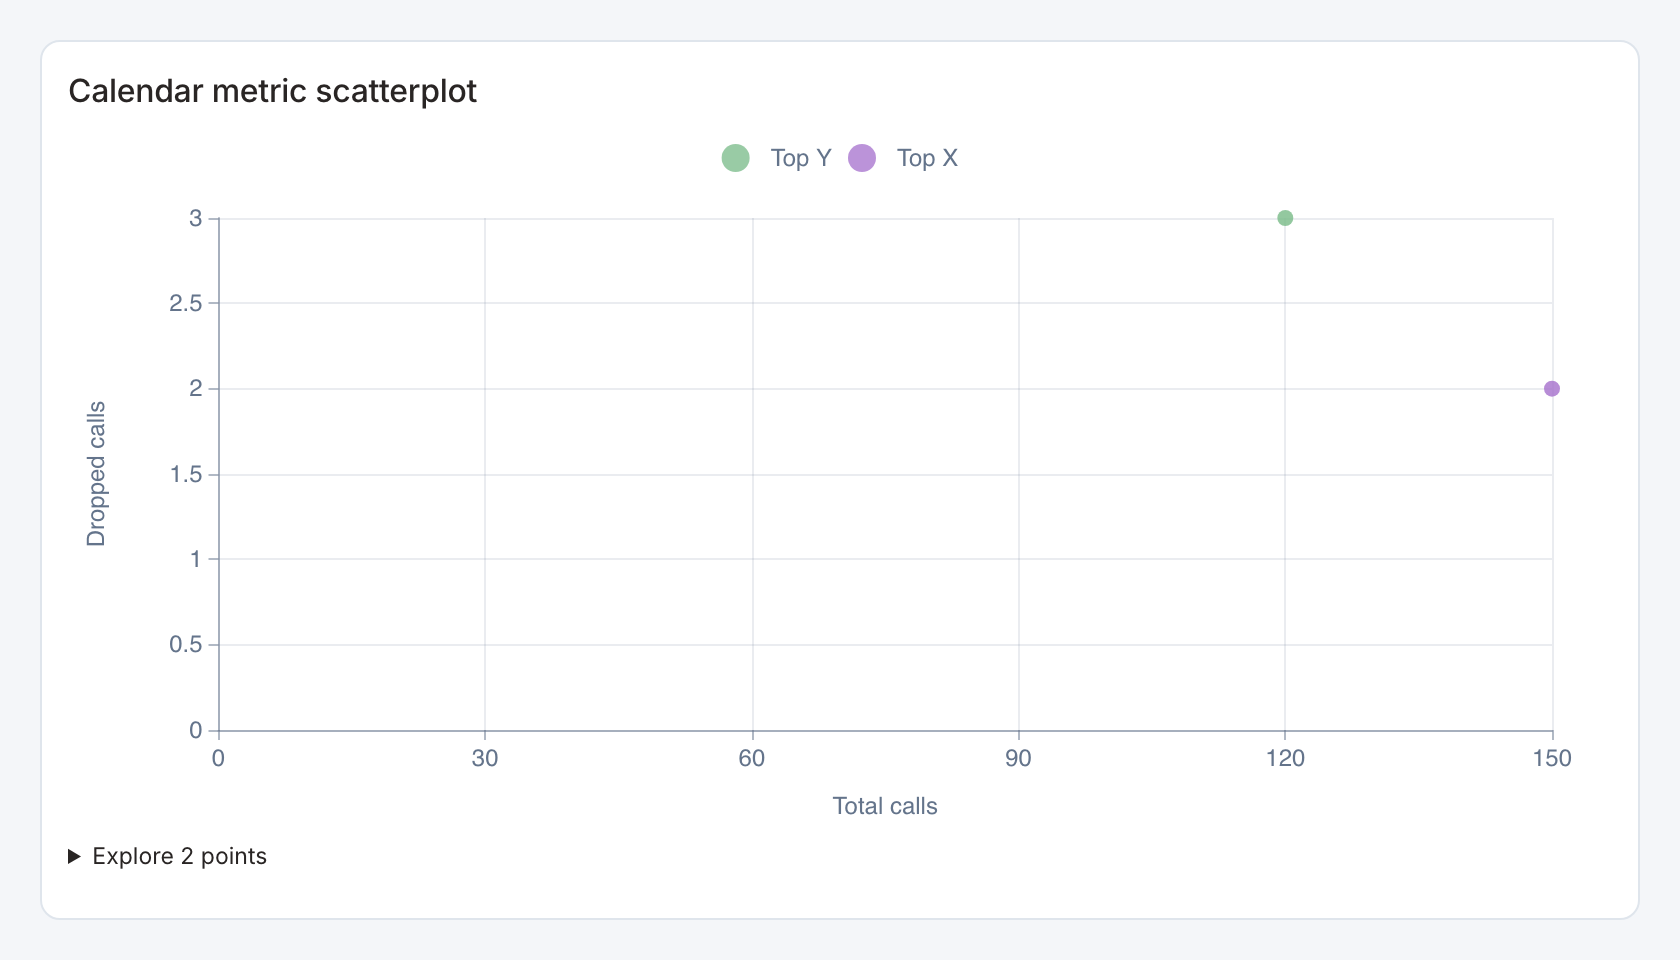
Required data and grain. One row per item and month, with candidate numeric measures.
| Example field | Type | Role in this example |
|---|---|---|
name | Text | Required |
period | ISO date text | Required |
calls | Number | Required |
drops | Number | Required |
Optional fields and bindings. Bind dashboard filters for x/y metric choice and optional calendar comparison scope. Provide complete comparison months if required.
Example result — first three rows.
name | period | calls | drops |
|---|---|---|---|
Tower A | 2026-01-01 | 100 | 4 |
Tower A | 2026-02-01 | 120 | 3 |
Tower B | 2026-01-01 | 140 | 3 |
Download the complete data example. Select this tile to load its preset settings, then use these column names in the visual builder or the example query.
Styling controls. Choose row/date fields, metric definitions, top N, axis labels, numeric formats, colors and marker styles.
Interactions. Bound x/y metric filters select the comparison measures. The starter disables automatic cross-filtering to keep metric exploration separate from linked category actions.
Check before publishing. Calendar comparisons need the prior period in the returned source, not just the currently selected month.
Heatmap matrix
Specialized widget · Picker tile heatmap-matrix
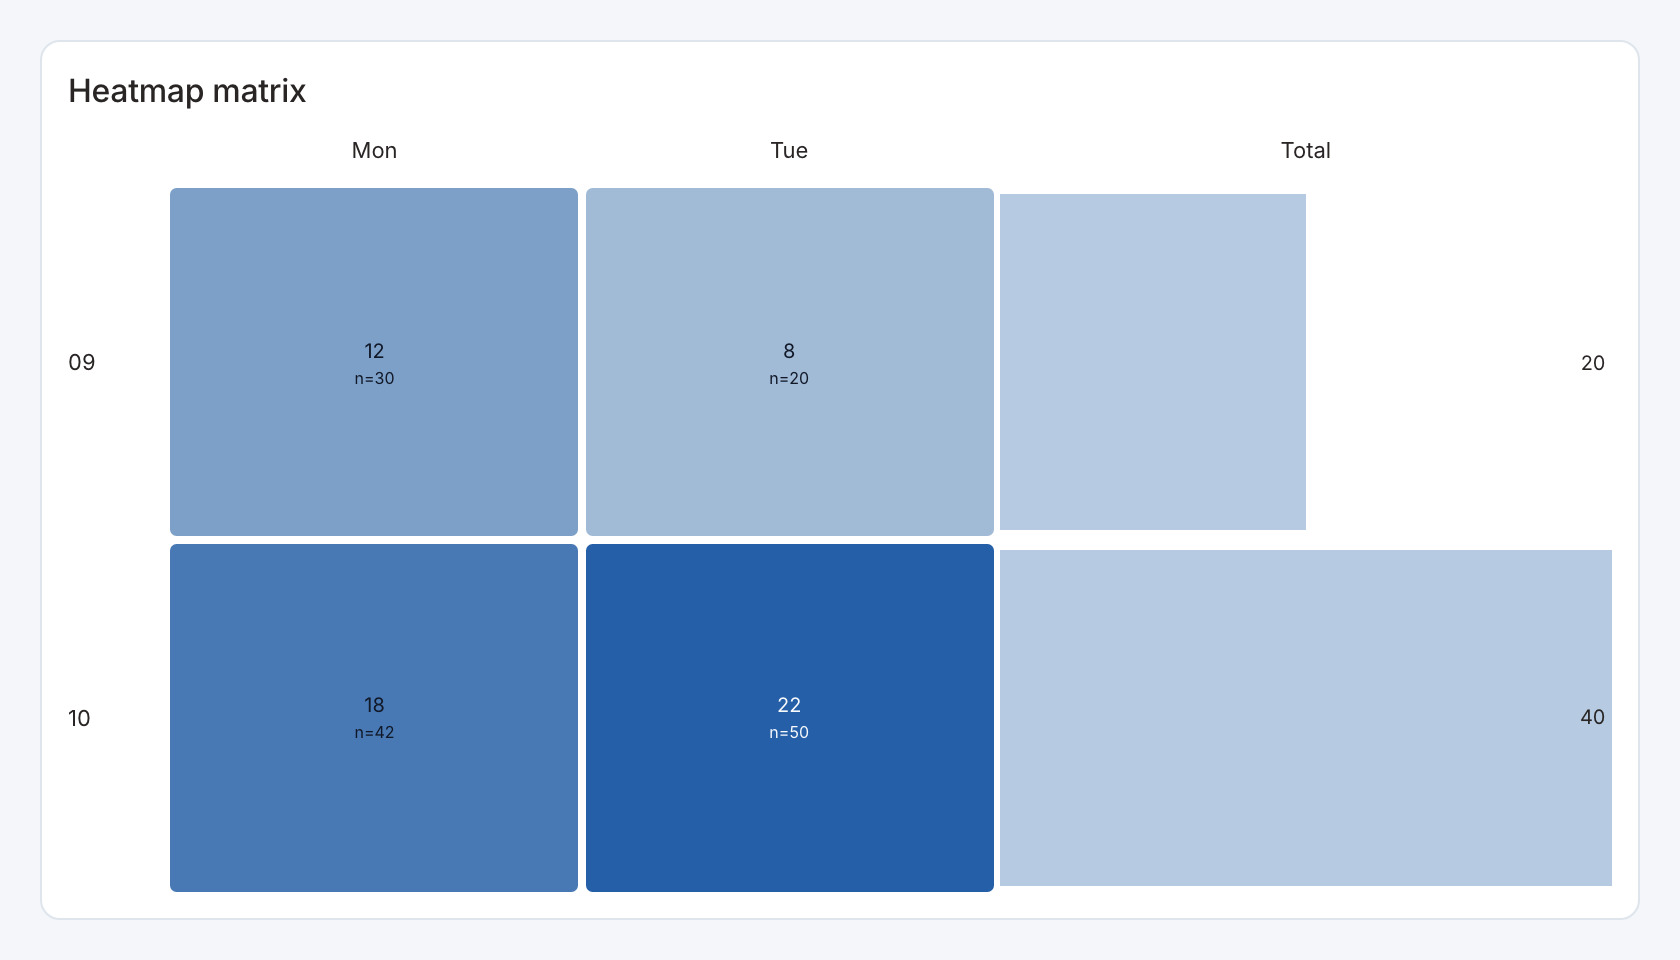
Required data and grain. Long form, one row per x/y pair and numeric value.
| Example field | Type | Role in this example |
|---|---|---|
weekday | Text | Required |
hour | Text | Required |
value | Number | Required |
sample | Number | Optional / available to map |
Optional fields and bindings. sample is optional cell detail. A separate size field and selection key can be mapped. Repeated cells aggregate under the configured rule.
Example result — first three rows.
weekday | hour | value | sample |
|---|---|---|---|
Mon | 09 | 12 | 30 |
Mon | 10 | 18 | 42 |
Tue | 09 | 8 | 20 |
Download the complete data example. Select this tile to load its preset settings, then use these column names in the visual builder or the example query.
Styling controls. Choose heatmap mode, axis category order, value labels, row totals, color bounds/midpoint, legend, text colors and cell shape. Bubble mode also supports size encoding.
Interactions. Cells with a value can send their configured selection key to an action. Map a stable key when x/y cells must filter independently.
Check before publishing. A value field and a size field can encode different measures. Label both legends and keep the selection value consistent with the receiving filter.
Bubble matrix
Specialized widget · Picker tile bubble-matrix
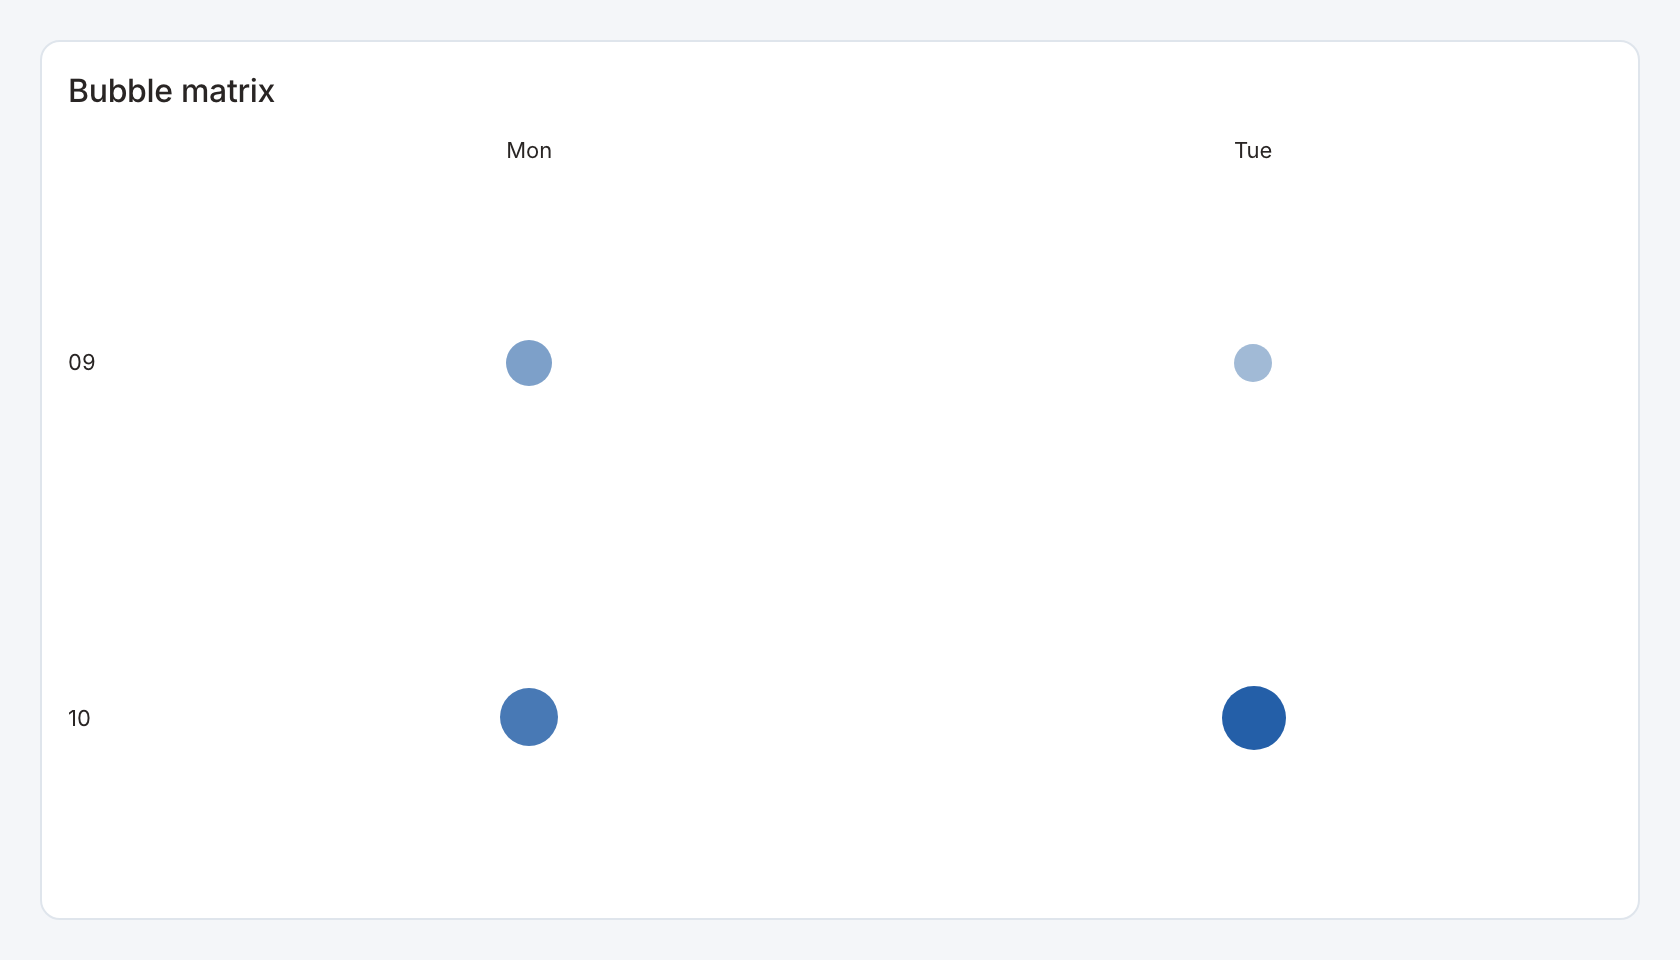
Required data and grain. Long form, one row per x/y pair and numeric value.
| Example field | Type | Role in this example |
|---|---|---|
weekday | Text | Required |
hour | Text | Required |
value | Number | Required |
sample | Number | Optional / available to map |
Optional fields and bindings. sample is optional cell detail. A separate size field and selection key can be mapped. Repeated cells aggregate under the configured rule.
Example result — first three rows.
weekday | hour | value | sample |
|---|---|---|---|
Mon | 09 | 12 | 30 |
Mon | 10 | 18 | 42 |
Tue | 09 | 8 | 20 |
Download the complete data example. Select this tile to load its preset settings, then use these column names in the visual builder or the example query.
Styling controls. Choose bubble mode, axis category order, value labels, row totals, color bounds/midpoint, legend, text colors and cell shape. Bubble mode also supports size encoding.
Interactions. Cells with a value can send their configured selection key to an action. Map a stable key when x/y cells must filter independently.
Check before publishing. A value field and a size field can encode different measures. Label both legends and keep the selection value consistent with the receiving filter.
Comparison radar
Specialized widget · Picker tile comparison-radar
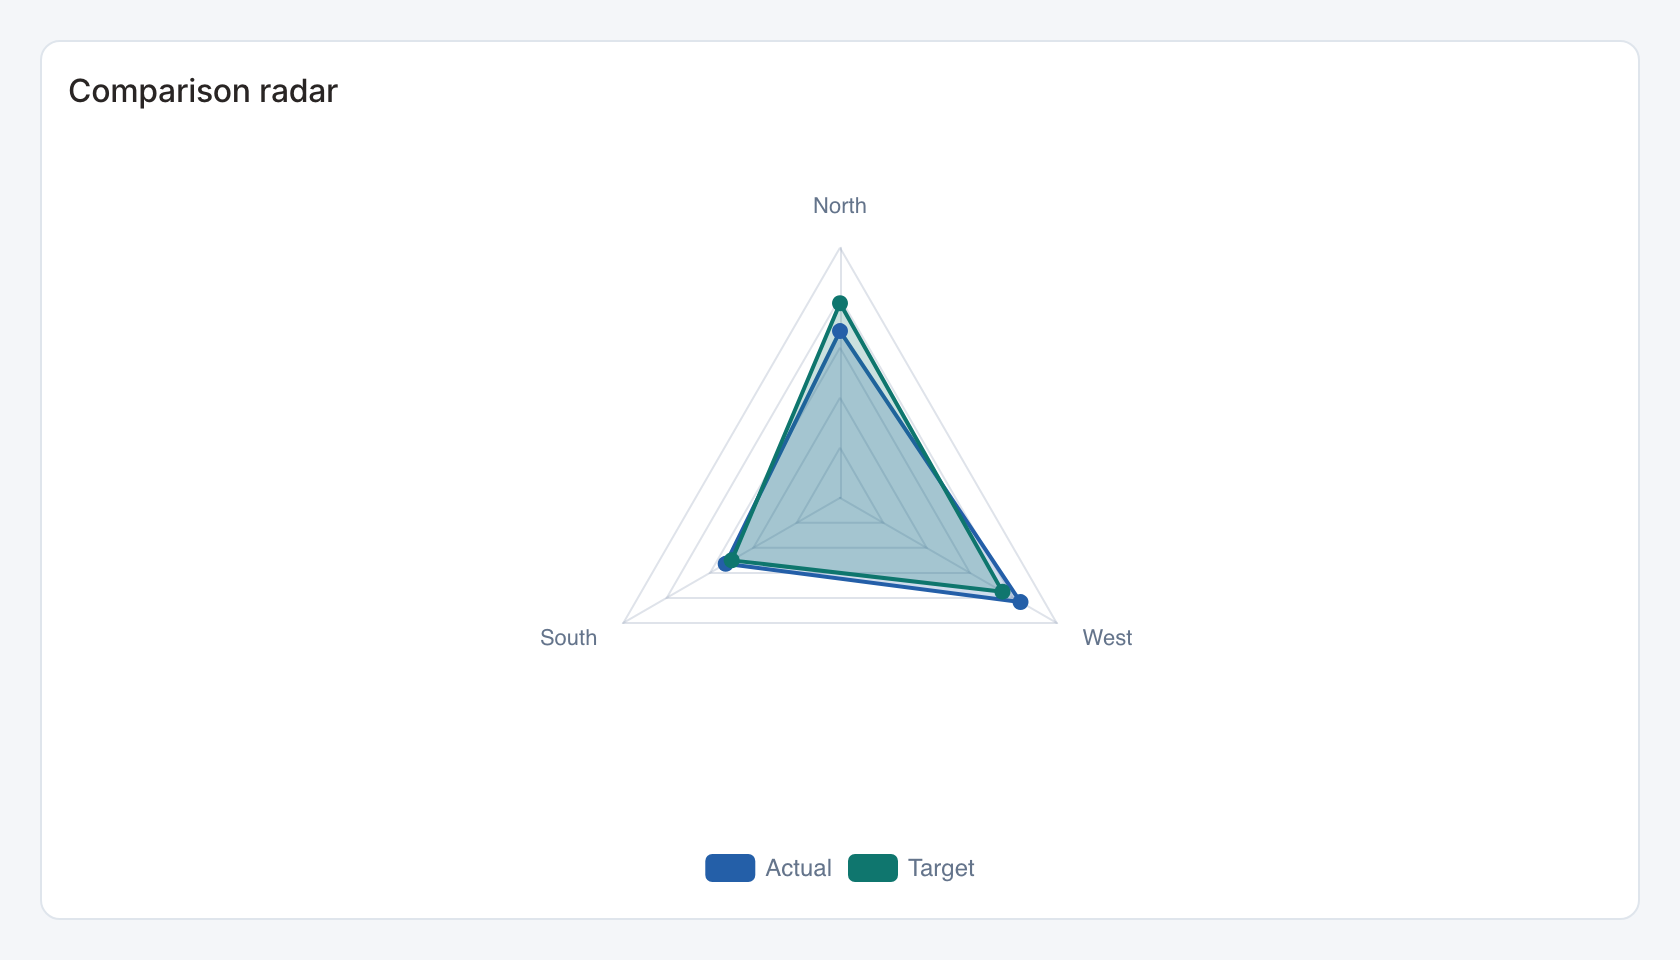
Required data and grain. One row per comparison category with actual and target numeric values.
| Example field | Type | Role in this example |
|---|---|---|
category | Text | Required |
value | Number | Required |
target | Number | Required |
previous | Number | Optional / available to map |
sample | Number | Optional / available to map |
secondary | Number | Optional / available to map |
Optional fields and bindings. Set the radar maximum explicitly when all spokes should use the same bound.
Example result.
category | value | target | previous | sample | secondary |
|---|---|---|---|---|---|
North | 120 | 140 | 105 | 80 | 18 |
South | 95 | 90 | 100 | 64 | 24 |
West | 150 | 135 | 130 | 92 | 12 |
Download the complete data example. Select this tile to load its preset settings, then use these column names in the visual builder or the example query.
Styling controls. Radar controls set target mapping, maximum, actual/target labels, colors and number formats.
Interactions. Use the category buttons for configured filter or drill-through actions. The radar plot itself is a visual comparison.
Check before publishing. Use compatible units and a consistent maximum. Mixing currency and rates across spokes can make the shape misleading.