ML views and Custom JS
Render supplied model results or connect a hosted visualization plugin.
Open Add widget and choose the exact tile name below. Standard tiles use a base renderer. Specialized widget tiles preload that renderer’s specialized view, field mappings and starter data. Both are editable in Studio. Read the shared data, styling and interaction guide before replacing starter data.
Screenshots. These are real Studio widgets with fictional sample data and example settings. Colors, labels and layout remain configurable. Select an image to view it at full size.
ML Forecast
Standard · Picker tile ml_forecast
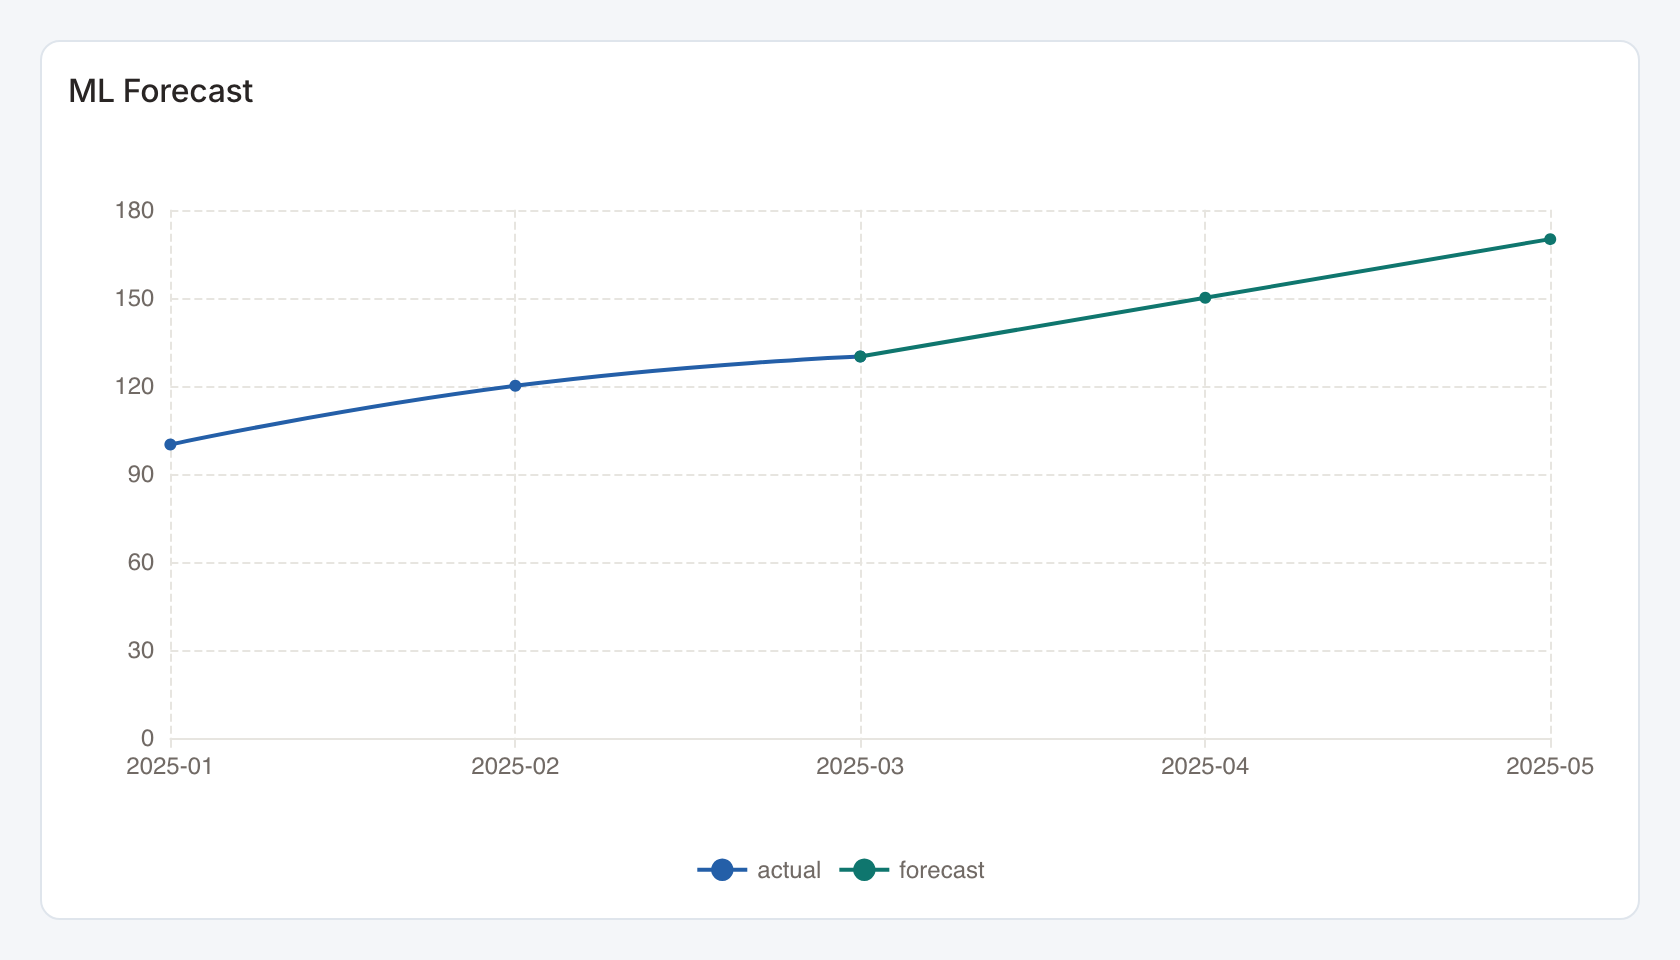
Required data and grain. One row per ordered time bucket, with actual and forecast numeric series.
| Example field | Type | Role in this example |
|---|---|---|
bucket | Text | Required |
actual | Number | Required |
forecast | Number | Required |
Optional fields and bindings. The query or upstream workflow must already provide the model outputs.
Example result — first three rows.
bucket | actual | forecast |
|---|---|---|
2025-01 | 100 | — |
2025-02 | 120 | — |
2025-03 | 130 | 130 |
Download the complete data example. Select this tile to load its preset settings, then use these column names in the visual builder or the example query.
Styling controls. Choose colors, legend, points, labels and grid visibility. Axis controls set titles, label rotation, ranges and number formats. Series controls customize supported line and bar series.
Interactions. Hover or toggle line series. Selecting a bucket can drive a configured filter or drill-through action.
Missing observations. Missing actual or forecast values remain gaps. The example shares a March value between observed history and forecast, without manufacturing zero observations.
Check before publishing. Optional lower and upper bounds are additional numeric lines in the current renderer, rather than a shaded prediction interval. Choosing the tile does not train a model or run inference.
ML Anomaly
Standard · Picker tile ml_anomaly
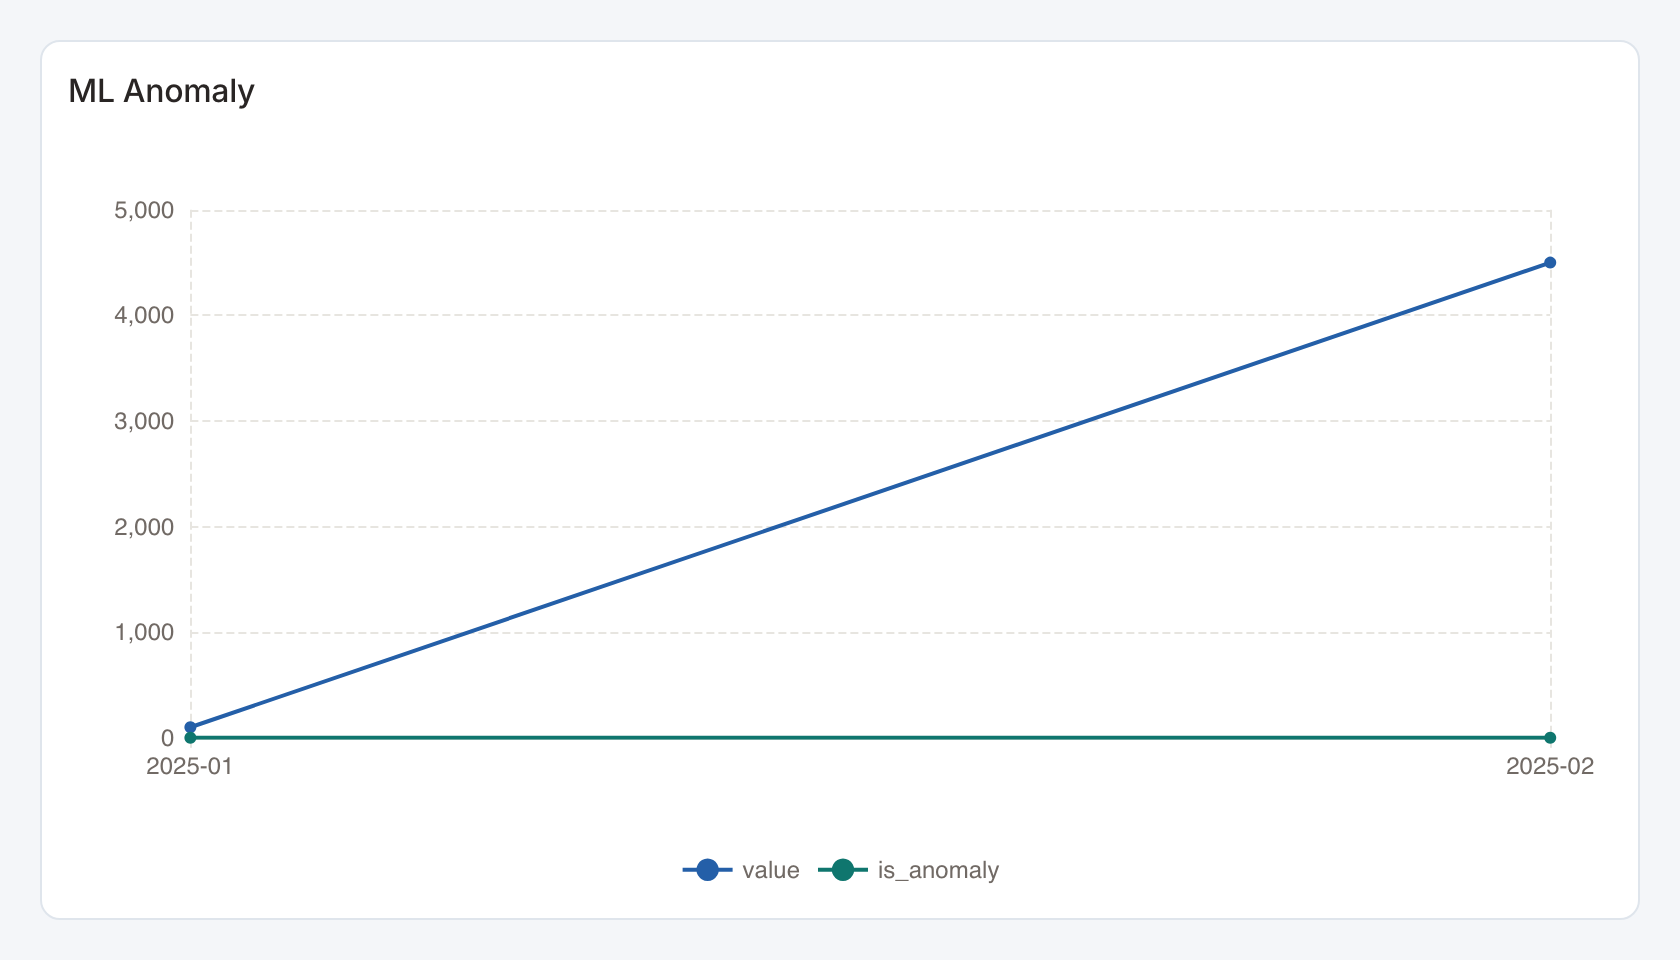
Required data and grain. One row per ordered bucket, with an observed value and optional anomaly flag.
| Example field | Type | Role in this example |
|---|---|---|
bucket | Text | Required |
value | Number | Required |
is_anomaly | Flag | Required |
Optional fields and bindings. The query or upstream workflow must already provide the model outputs.
Example result.
bucket | value | is_anomaly |
|---|---|---|
2025-01 | 100 | 0 |
2025-02 | 4500 | 1 |
Download the complete data example. Select this tile to load its preset settings, then use these column names in the visual builder or the example query.
Styling controls. Choose colors, legend, points, labels and grid visibility. Axis controls set titles, label rotation, ranges and number formats. Series controls customize supported line and bar series.
Interactions. Hover or toggle line series. Selecting a bucket can drive a configured filter or drill-through action.
Check before publishing. The current view uses a line renderer. It does not draw dedicated anomaly markers from the flag. A numeric flag may appear as an extra line. Inspect the flag in the data table and hide that series when it would confuse the value scale. Choosing the tile does not train a model or run inference.
Predicted vs Actual
Standard · Picker tile ml_prediction_actual
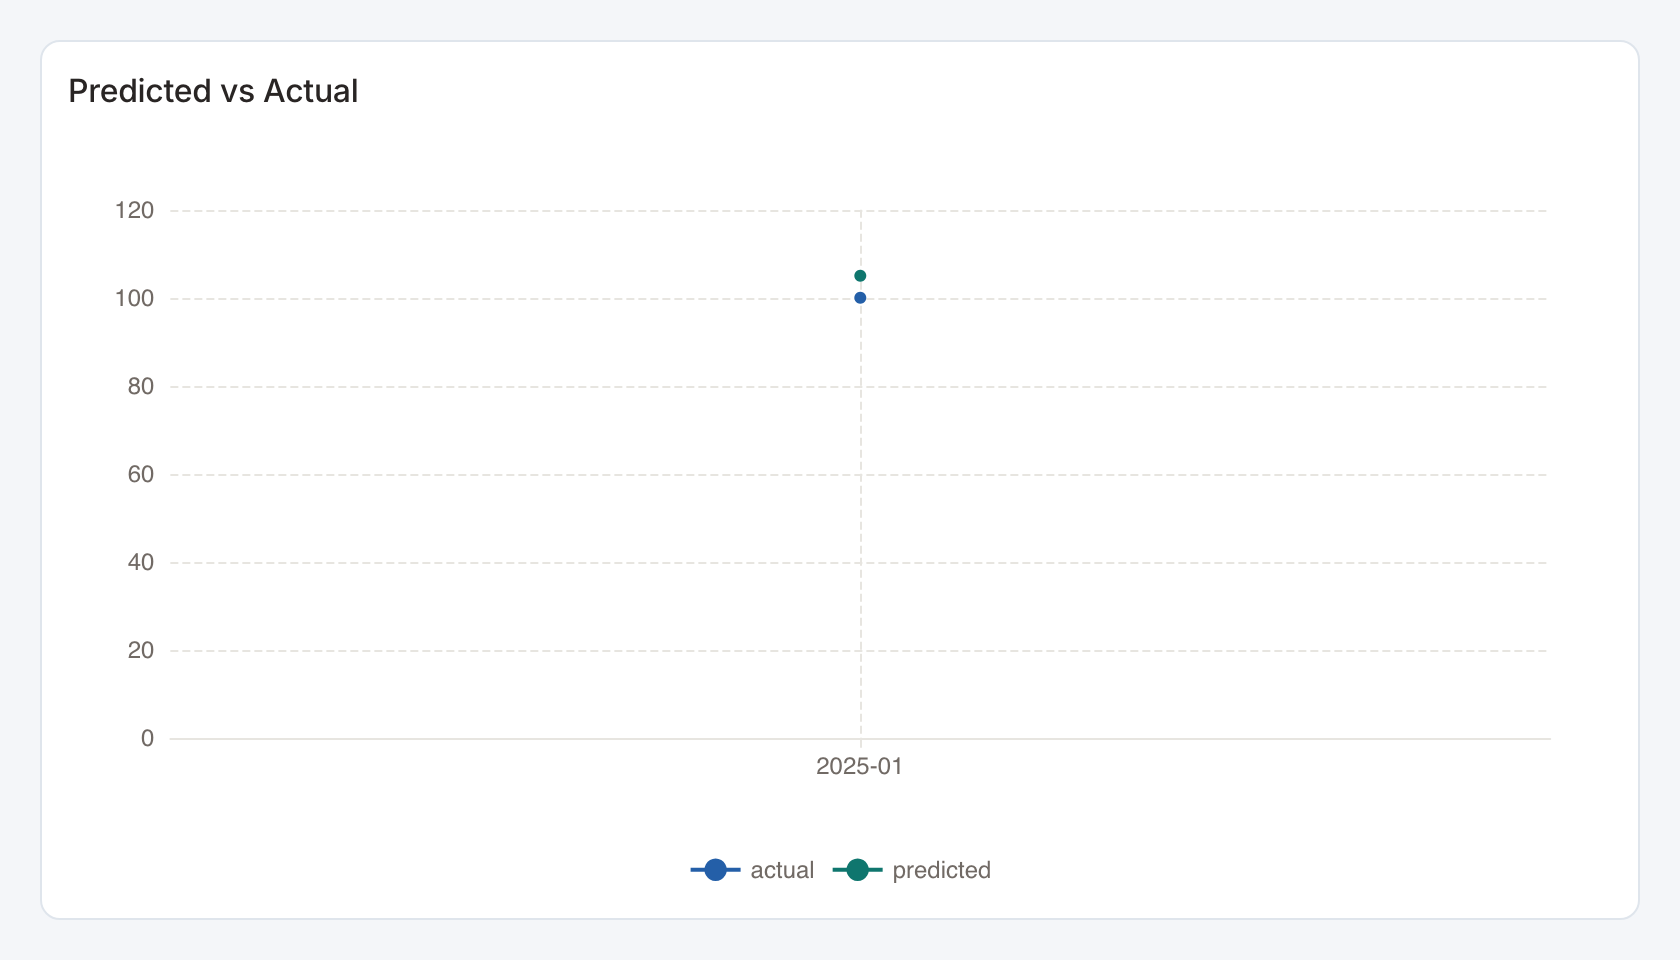
Required data and grain. One row per ordered bucket, with numeric actual and predicted values.
| Example field | Type | Role in this example |
|---|---|---|
bucket | Text | Required |
actual | Number | Required |
predicted | Number | Required |
Optional fields and bindings. The query or upstream workflow must already provide the model outputs.
Example result.
bucket | actual | predicted |
|---|---|---|
2025-01 | 100 | 105 |
Download the complete data example. Select this tile to load its preset settings, then use these column names in the visual builder or the example query.
Styling controls. Choose colors, legend, points, labels and grid visibility. Axis controls set titles, label rotation, ranges and number formats. Series controls customize supported line and bar series.
Interactions. Hover or toggle line series. Selecting a bucket can drive a configured filter or drill-through action.
Check before publishing. The current view draws actual and predicted as lines against the first column. It is not an actual-versus-predicted scatterplot. Choosing the tile does not train a model or run inference.
Feature Importance
Standard · Picker tile ml_feature_importance
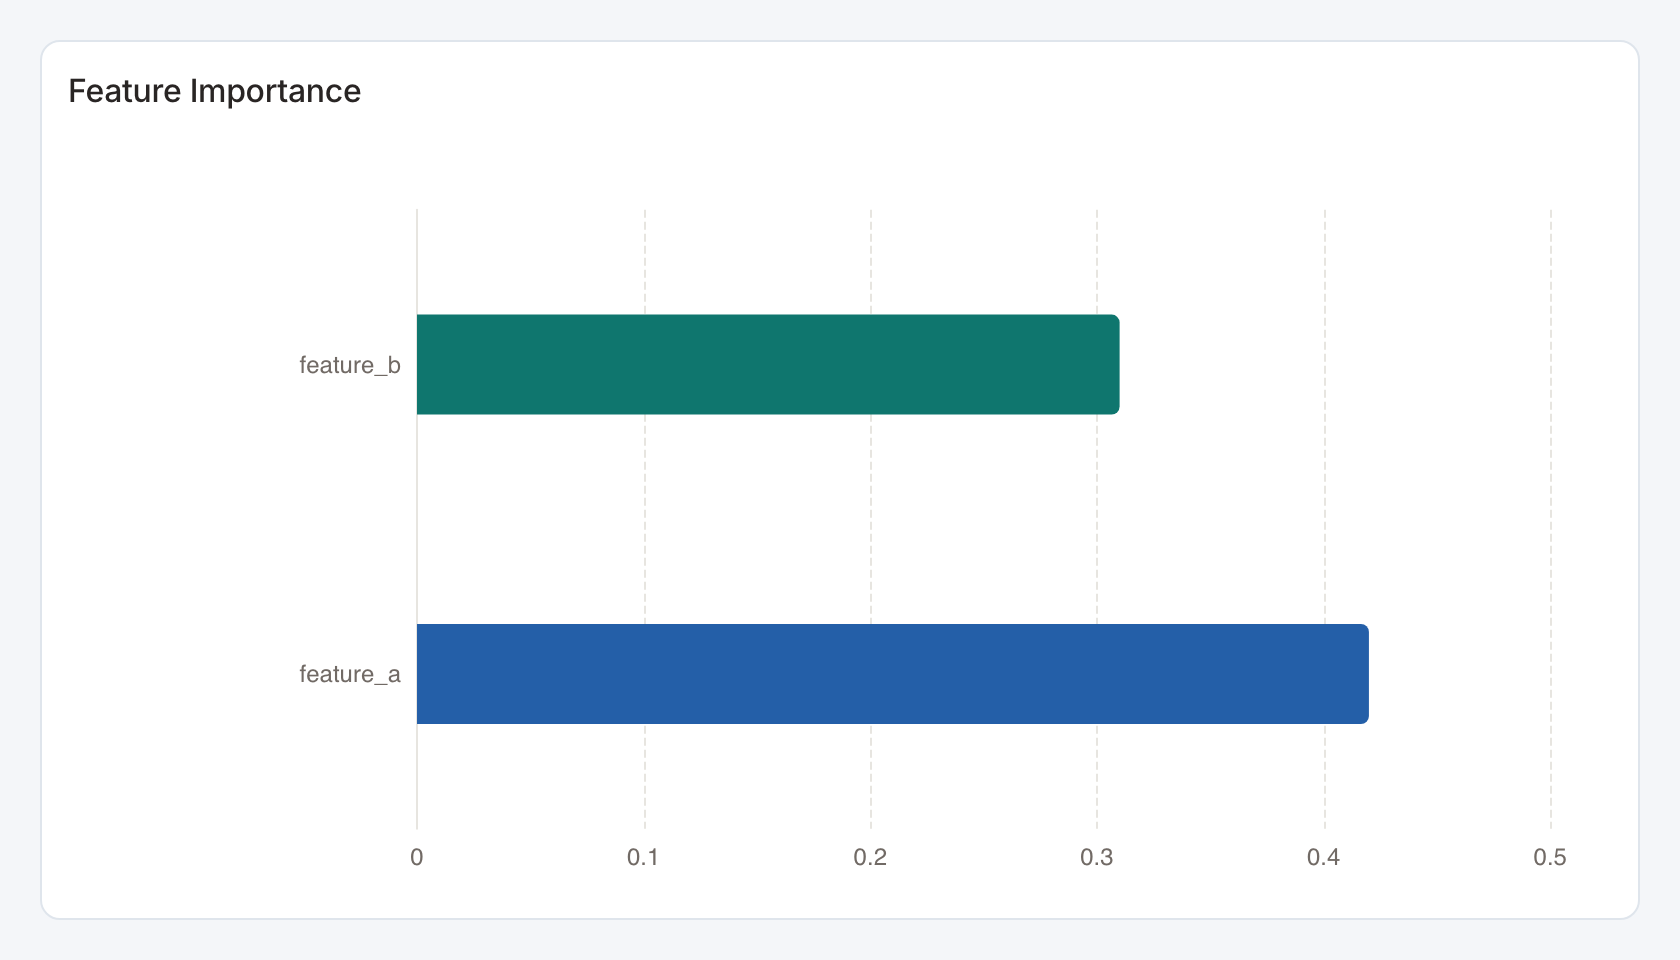
Required data and grain. One row per feature. First column is feature name and second numeric importance.
| Example field | Type | Role in this example |
|---|---|---|
feature | Text | Required |
importance | Number | Required |
Optional fields and bindings. Prepare the importance values with the model or upstream workflow.
Example result.
feature | importance |
|---|---|
feature_a | 0.42 |
feature_b | 0.31 |
Download the complete data example. Select this tile to load its preset settings, then use these column names in the visual builder or the example query.
Styling controls. Uses a horizontal bar chart. Set palette, labels, axes and number format.
Interactions. Marks can send the selected category to a configured filter or drill-through action in view and presentation modes. Test the receiving widget with the same category and filter name.
Check before publishing. The tile displays supplied values. It does not calculate feature importance. Explain whether values are normalized, signed or model-specific.
Custom JS
Standard · Picker tile custom_viz
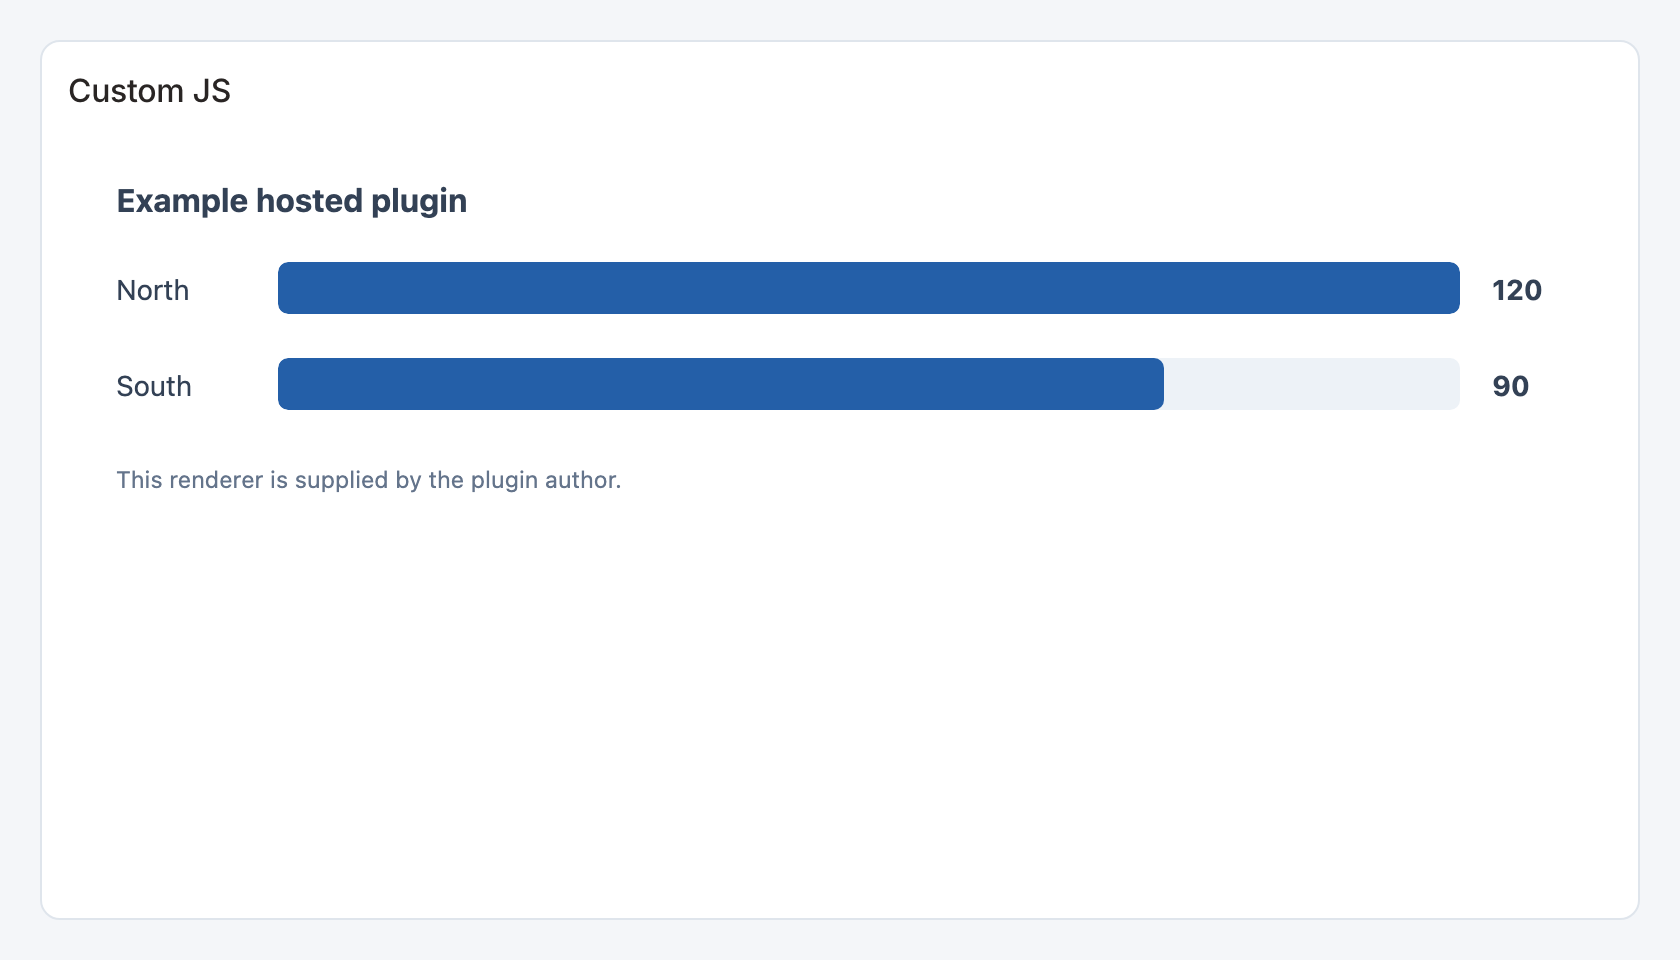
This example uses an author-supplied plugin inside the Custom JS widget. The configured plugin determines its appearance.
Required data and grain. Any tabular query result. The hosted plugin receives the result columns and rows.
| Example field | Type | Role in this example |
|---|---|---|
category | Text | Required |
value | Number | Required |
Optional fields and bindings. Configure a plugin URL in the Custom JS options. The example data alone does not provide a renderer.
Example result.
category | value |
|---|---|
North | 120 |
South | 90 |
Download the complete data example. Select this tile to load its preset settings, then use these column names in the visual builder or the example query.
Styling controls. Styling inside the plugin is implemented by the plugin author. Studio frame controls still set the surrounding title, background, padding and border.
Interactions. A plugin can request a filter after it receives data. Map that request to the intended Studio filter action and test it in view mode.
Check before publishing. The URL must be allowed by the deployment’s frame and content policies. This is the plugin tile, separate from the built-in custom chart presets documented throughout this catalog.