KPIs and gauges
Headline values, comparison cards, utilization and carbon clocks.
Open Add widget and choose the exact tile name below. Standard tiles use a base renderer. Specialized widget tiles preload that renderer’s specialized view, field mappings and starter data. Both are editable in Studio. Read the shared data, styling and interaction guide before replacing starter data.
Screenshots. These are real Studio widgets with fictional sample data and example settings. Colors, labels and layout remain configurable. Select an image to view it at full size.
Metric
Standard · Picker tile metric_card
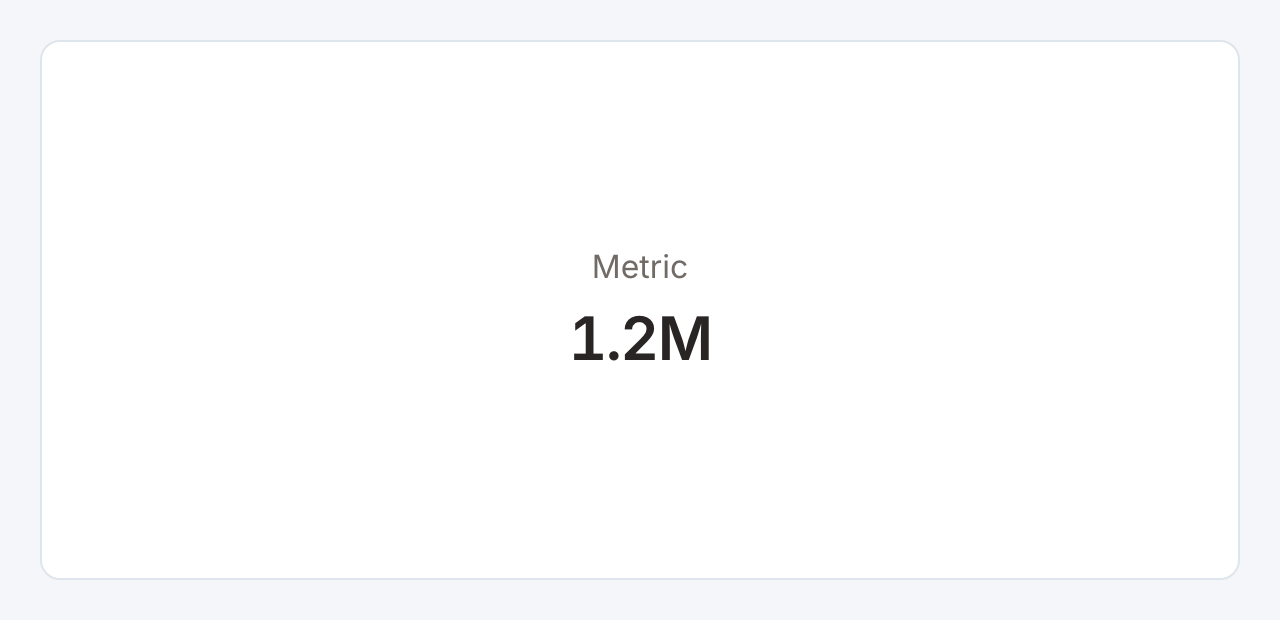
Required data and grain. One result row for the headline value. Bind a numeric value field. With the default mapping the first cell supplies the value.
| Example field | Type | Role in this example |
|---|---|---|
value | Number | Required |
Optional fields and bindings. Bind a previous-value column for change, a secondary-value column for a second measure, or a sparkline column across ordered rows. Repeat the same headline and previous values on trend rows.
Example result.
value |
|---|
1234567 |
Download the complete data example. Select this tile to load its preset settings, then use these column names in the visual builder or the example query.
Styling controls. Metric controls set title and value sizes, bold, italic, underline, alignment, number format, prefix, suffix and change label. Choose a plain, custom or performance background and whether lower values are better. Sparkline style can fill the card background.
Interactions. With an explicit filter action and its source column present in the first result row, the whole card can select that row’s value. A total-only result needs a separate category or key column to act as a category filter.
Check before publishing. Percent formatting expects a fraction such as 0.72 for 72%. A missing value is different from zero.
Gauge
Standard · Picker tile gauge
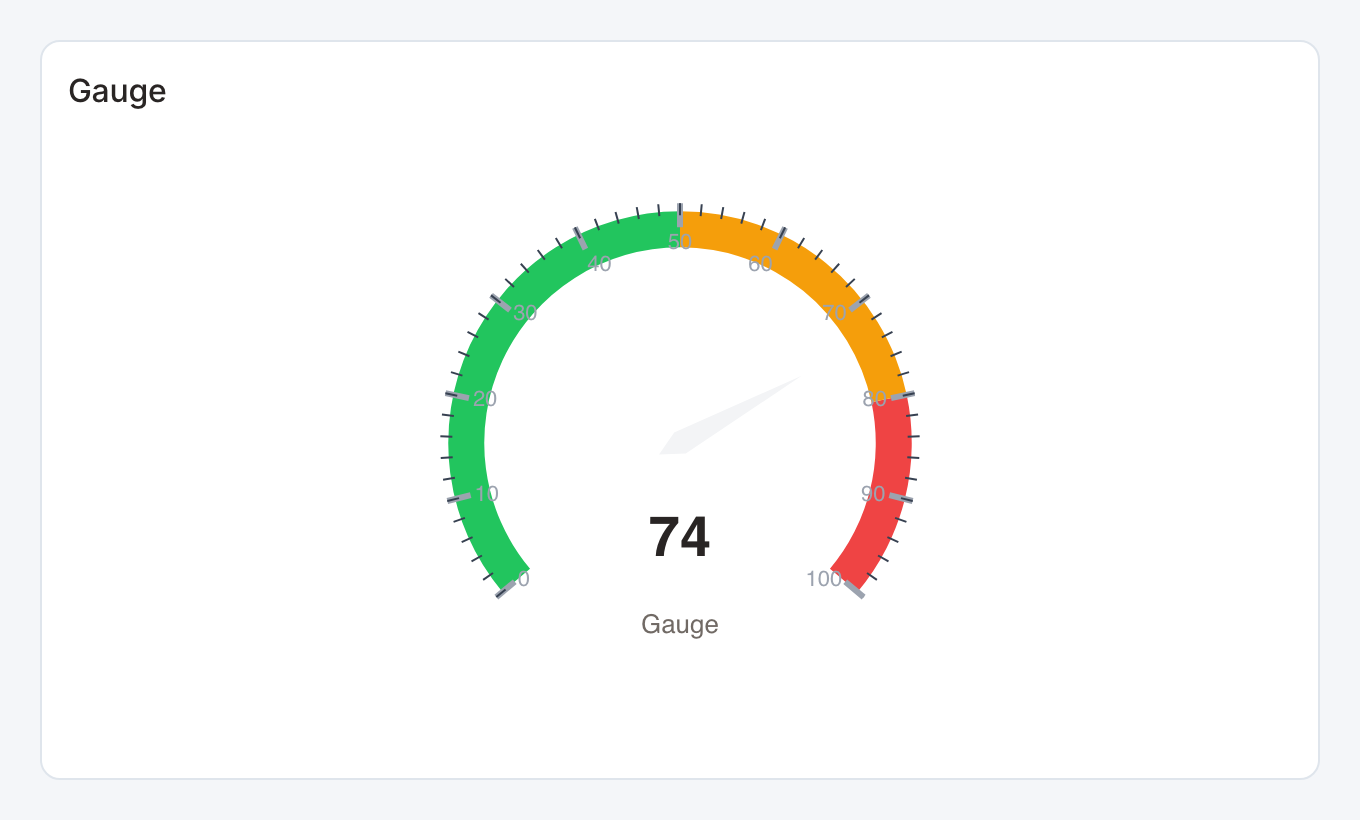
Required data and grain. One row. The first numeric column is the current value.
| Example field | Type | Role in this example |
|---|---|---|
pct | Number | Required |
Optional fields and bindings. A second column can supply maximum and a third minimum. Otherwise the default range is 0–100. Gauge controls can provide bounds and target.
Example result.
pct |
|---|
73.5 |
Download the complete data example. Select this tile to load its preset settings, then use these column names in the visual builder or the example query.
Styling controls. Choose gauge layout, range, target, colors, value format and labels. Size the card to leave room for the dial.
Interactions. Hover for values where a tooltip is shown. This renderer does not send mark selections to dashboard filters or drill-through.
Check before publishing. Keep the value, bounds and target in the same units.
Status KPI
Specialized widget · Picker tile status-kpi
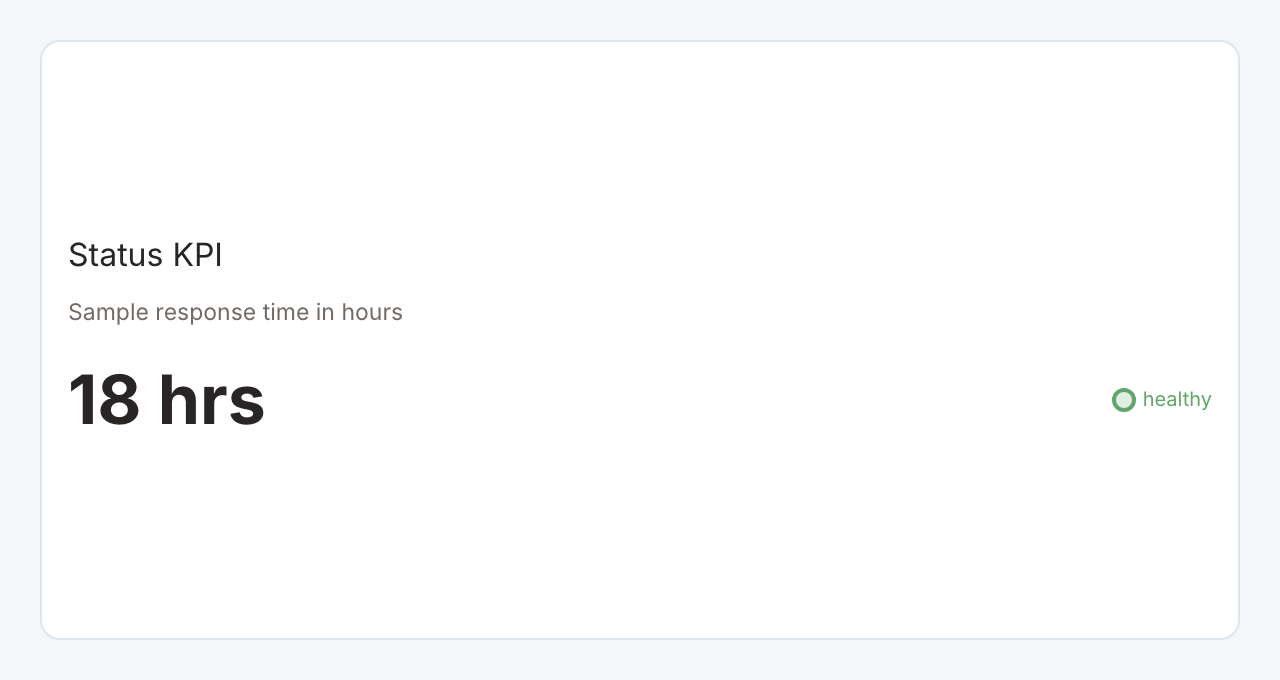
Required data and grain. A first result row with a numeric value. The starter supplies warning and critical thresholds as fields.
| Example field | Type | Role in this example |
|---|---|---|
value | Number | Required |
warning | Number | Required |
critical | Number | Required |
Optional fields and bindings. Threshold controls can instead use fixed numeric thresholds. A stable category field can support a card action.
Example result.
value | warning | critical |
|---|---|---|
18 | 20 | 30 |
Download the complete data example. Select this tile to load its preset settings, then use these column names in the visual builder or the example query.
Styling controls. Metric controls set title and value sizes, bold, italic, underline, alignment, number format, prefix, suffix and change label. Choose a plain, custom or performance background and whether lower values are better. Status controls choose threshold direction, healthy/warning/critical colors and subtitle.
Interactions. With an explicit filter action and its source column present in the first result row, the whole card can select that row’s value. A total-only result needs a separate category or key column to act as a category filter.
Check before publishing. With direction above, higher values cross warning and critical limits. Reverse the direction for measures where low values signal a problem.
Reference-year KPI
Specialized widget · Picker tile reference-kpi
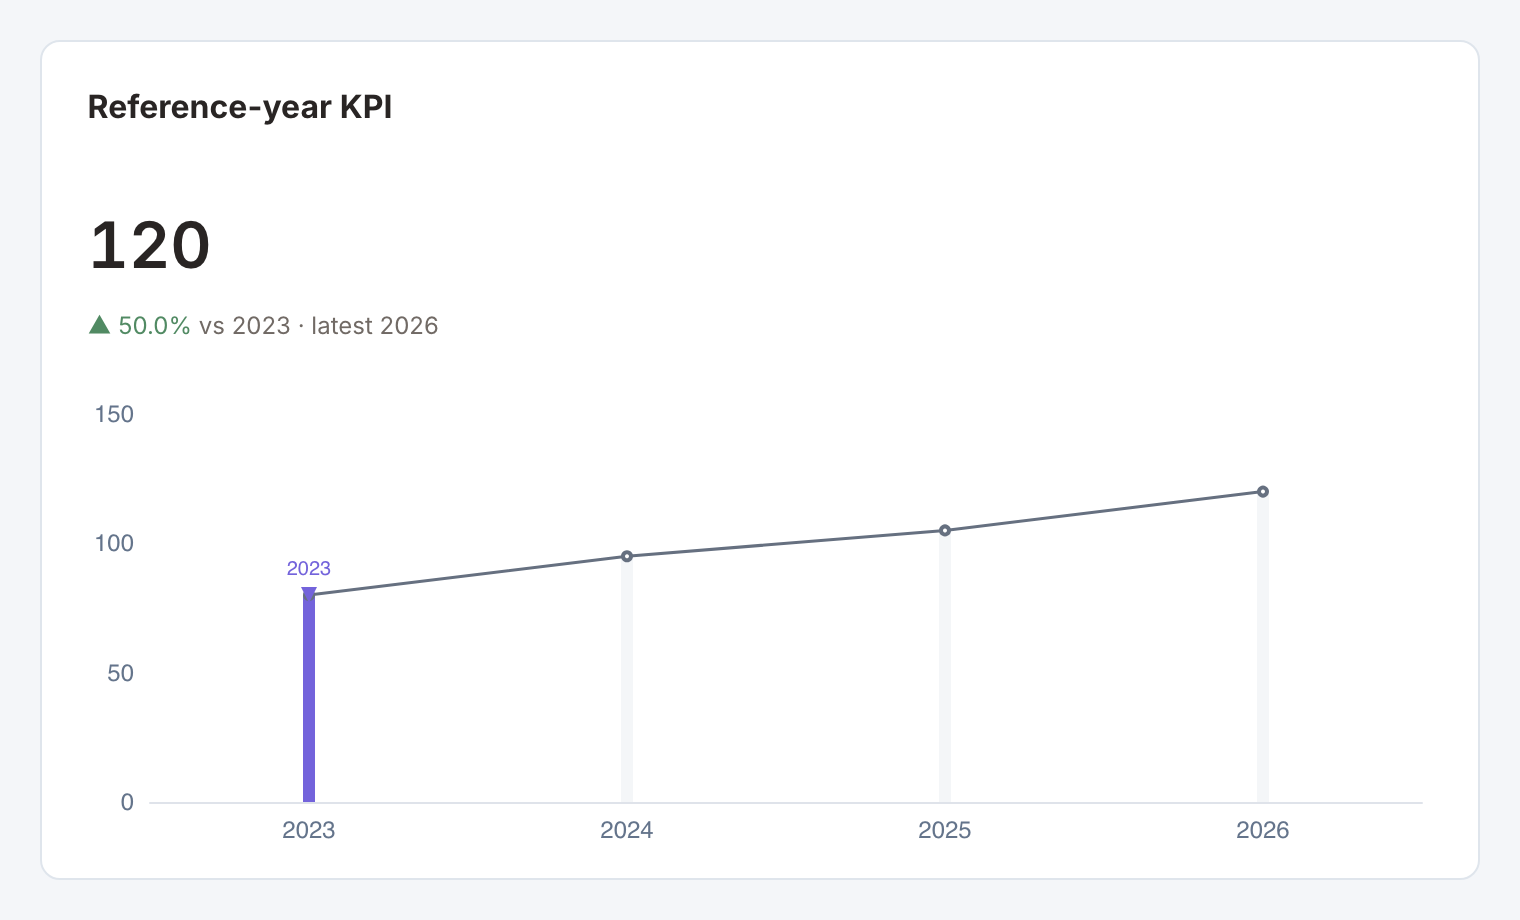
Required data and grain. Ordered trend rows, with repeated headline value, previous value and reference-year value.
| Example field | Type | Role in this example |
|---|---|---|
year | Number | Required |
trend | Number | Required |
value | Number | Required |
previous | Number | Required |
reference_year | Number | Required |
Optional fields and bindings. Reference controls can bind a dashboard reference-year filter and customize comparison labels.
Example result — first three rows.
year | trend | value | previous | reference_year |
|---|---|---|---|---|
2023 | 80 | 120 | 80 | 2023 |
2024 | 95 | 120 | 80 | 2023 |
2025 | 105 | 120 | 80 | 2023 |
Download the complete data example. Select this tile to load its preset settings, then use these column names in the visual builder or the example query.
Styling controls. Metric controls set title and value sizes, bold, italic, underline, alignment, number format, prefix, suffix and change label. Choose a plain, custom or performance background and whether lower values are better. Reference trend controls set the year and trend fields, reference selection and presentation.
Interactions. A configured reference-year filter changes the comparison. With an explicit filter action and its source column present in the first result row, the whole card can select that row’s value. A total-only result needs a separate category or key column to act as a category filter.
Check before publishing. Use one consistent headline value across trend rows. A reference value is not a new engine forecast.
Carbon clock
Specialized widget · Picker tile carbon-clock
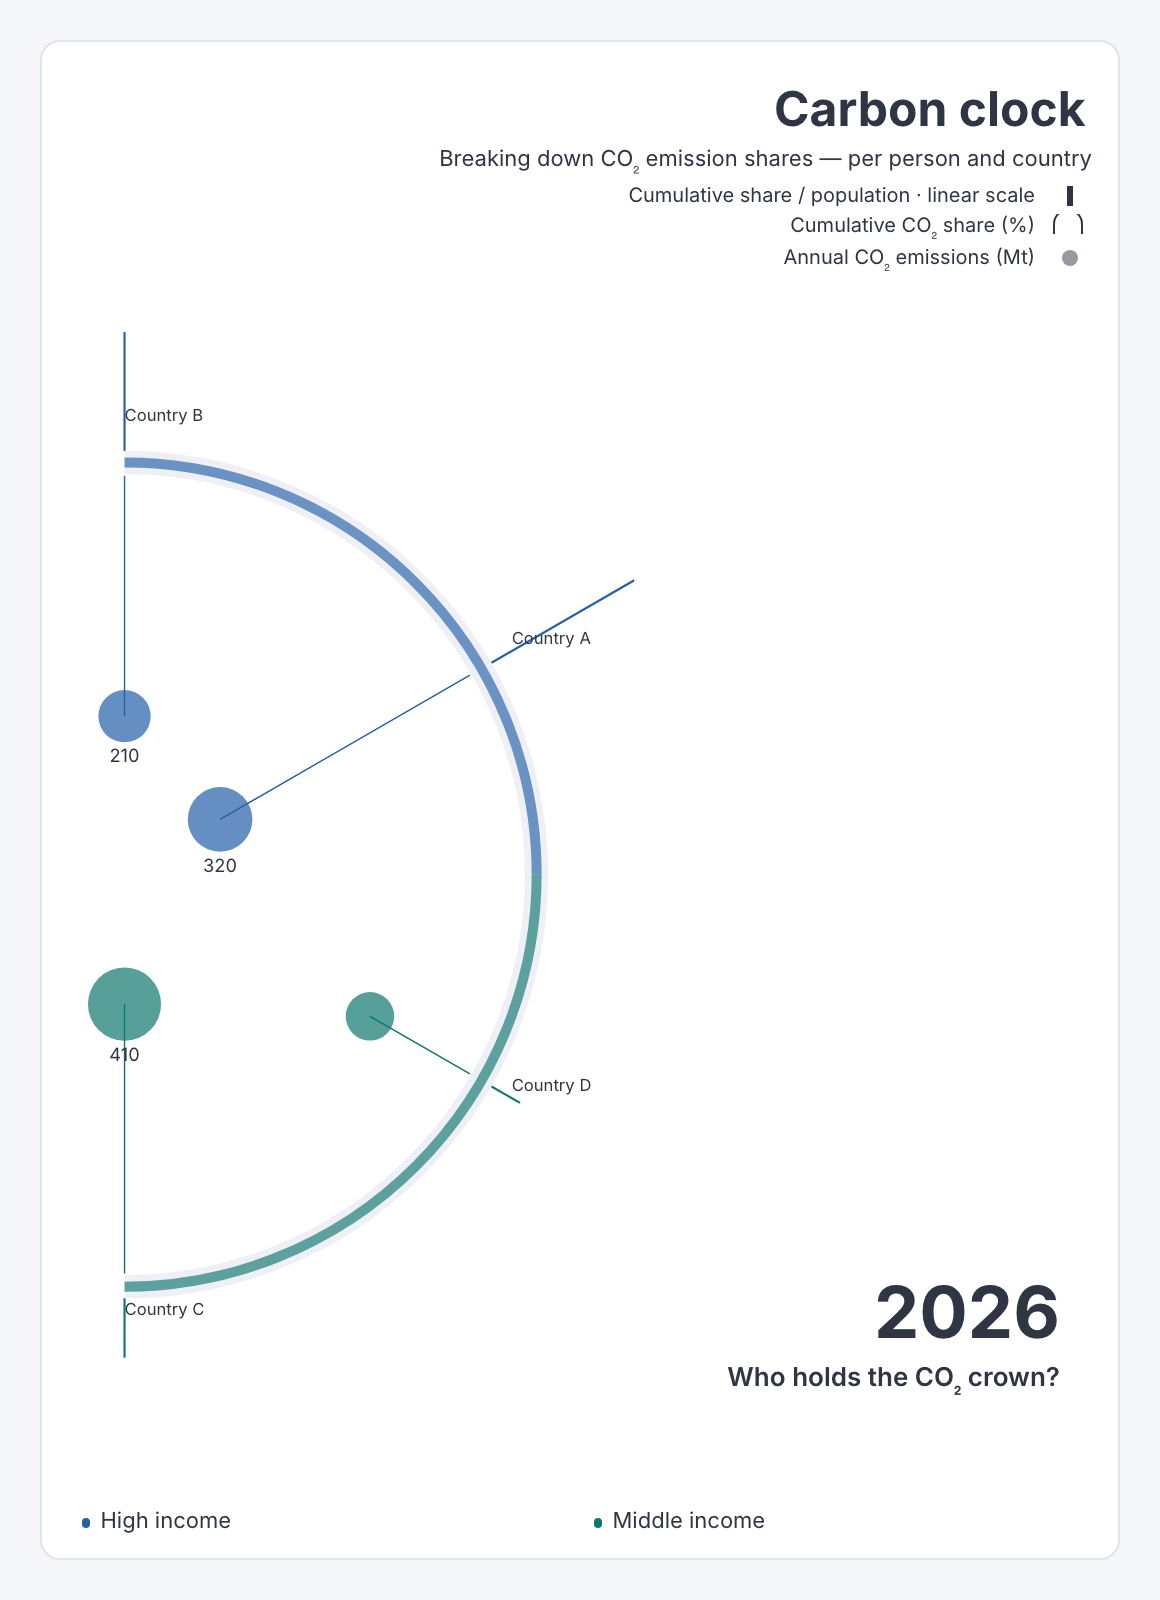
Required data and grain. One row per country for the selected year, with income group and three numeric measures. annual is annual CO₂ emissions in million tonnes, cumulative is cumulative CO₂ share as percentage points, and per_person is cumulative share divided by population share.
| Example field | Type | Role in this example |
|---|---|---|
country | Text | Required |
income_group | Text | Required |
year | Number | Required |
annual | Number | Required |
cumulative | Number | Required |
per_person | Number | Required |
Optional fields and bindings. Filter the dataset to one reporting year using a dashboard-bound condition. Precompute all three measures in the source. The built-in measure key uses these CO₂-specific units.
Example result — first three rows.
country | income_group | year | annual | cumulative | per_person |
|---|---|---|---|---|---|
Country A | High income | 2026 | 320 | 30 | 2.5 |
Country B | High income | 2026 | 210 | 25 | 1.8 |
Country C | Middle income | 2026 | 410 | 28 | 0.9 |
Download the complete data example. Select this tile to load its preset settings, then use these column names in the visual builder or the example query.
Styling controls. Clock controls choose semicircle or alternate layout, outer-bar and bubble measures, linear/square-root/log bar scale, country order, labels, group colors, sizes, key placement, mark geometry and dark or light frame styling.
Interactions. Country marks support pointer and keyboard selection for a configured country action. A dashboard year filter changes the clock only when the dataset is bound to that filter. Measure choices are author settings in the clock editor.
Check before publishing. The clock visualizes supplied data. It does not estimate missing emissions, population or real-time carbon emissions. Return one selected year and document the source period. A cumulative share of 30 means 30%, while the per-person value is a ratio rather than tonnes per person.
Radial carbon clock
Specialized widget · Picker tile radial-carbon-clock
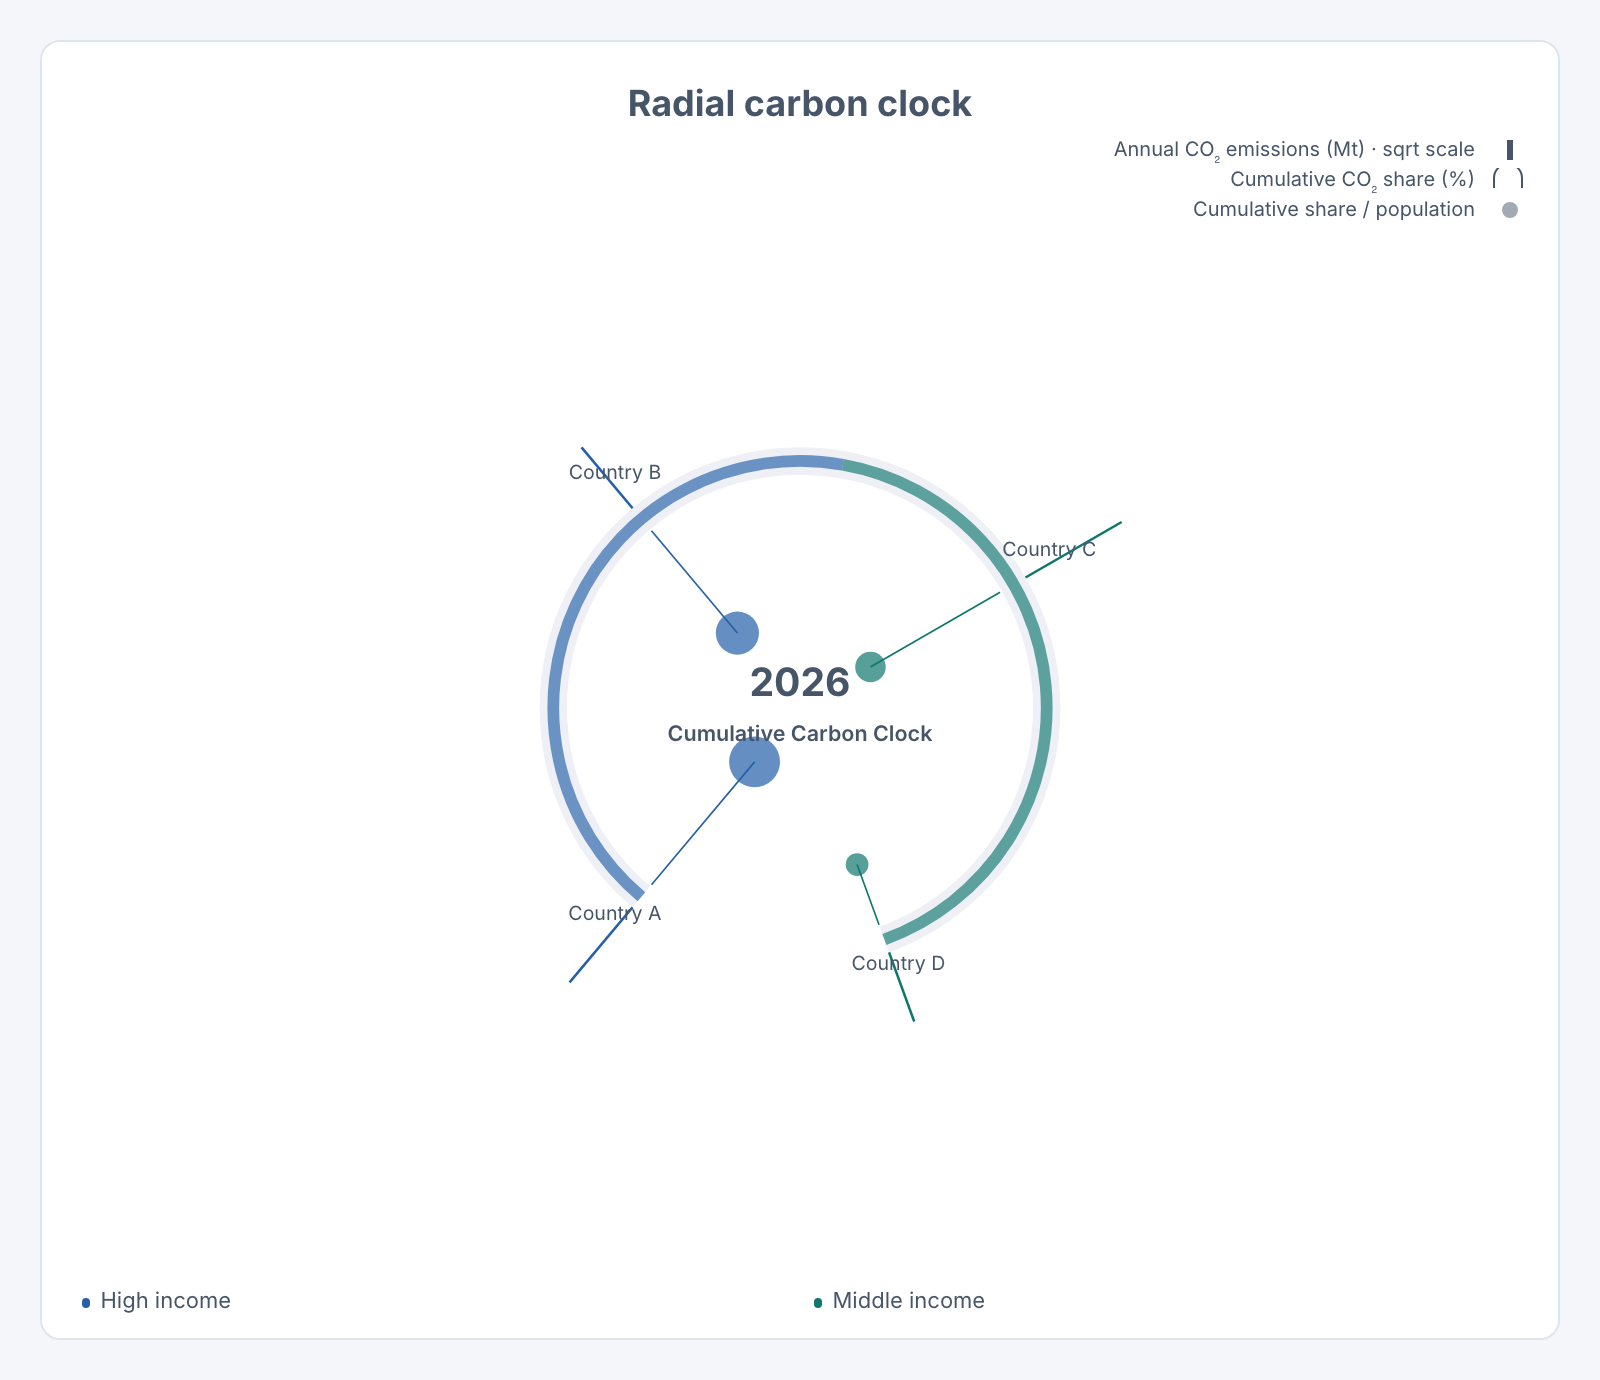
Required data and grain. One row per country for the selected year, with income group and three numeric measures. annual is annual CO₂ emissions in million tonnes, cumulative is cumulative CO₂ share as percentage points, and per_person is cumulative share divided by population share.
| Example field | Type | Role in this example |
|---|---|---|
country | Text | Required |
income_group | Text | Required |
year | Number | Required |
annual | Number | Required |
cumulative | Number | Required |
per_person | Number | Required |
Optional fields and bindings. Filter the dataset to one reporting year using a dashboard-bound condition. Precompute all three measures in the source. The built-in measure key uses these CO₂-specific units.
Example result — first three rows.
country | income_group | year | annual | cumulative | per_person |
|---|---|---|---|---|---|
Country A | High income | 2026 | 320 | 30 | 2.5 |
Country B | High income | 2026 | 210 | 25 | 1.8 |
Country C | Middle income | 2026 | 410 | 28 | 0.9 |
Download the complete data example. Select this tile to load its preset settings, then use these column names in the visual builder or the example query.
Styling controls. Clock controls choose radial or alternate layout, outer-bar and bubble measures, linear/square-root/log bar scale, country order, labels, group colors, sizes, key placement, mark geometry and dark or light frame styling.
Interactions. Country marks support pointer and keyboard selection for a configured country action. A dashboard year filter changes the clock only when the dataset is bound to that filter. Measure choices are author settings in the clock editor.
Check before publishing. The clock visualizes supplied data. It does not estimate missing emissions, population or real-time carbon emissions. Return one selected year and document the source period. A cumulative share of 30 means 30%, while the per-person value is a ratio rather than tonnes per person.
Date-range comparison KPI
Specialized widget · Picker tile date-range-comparison-kpi
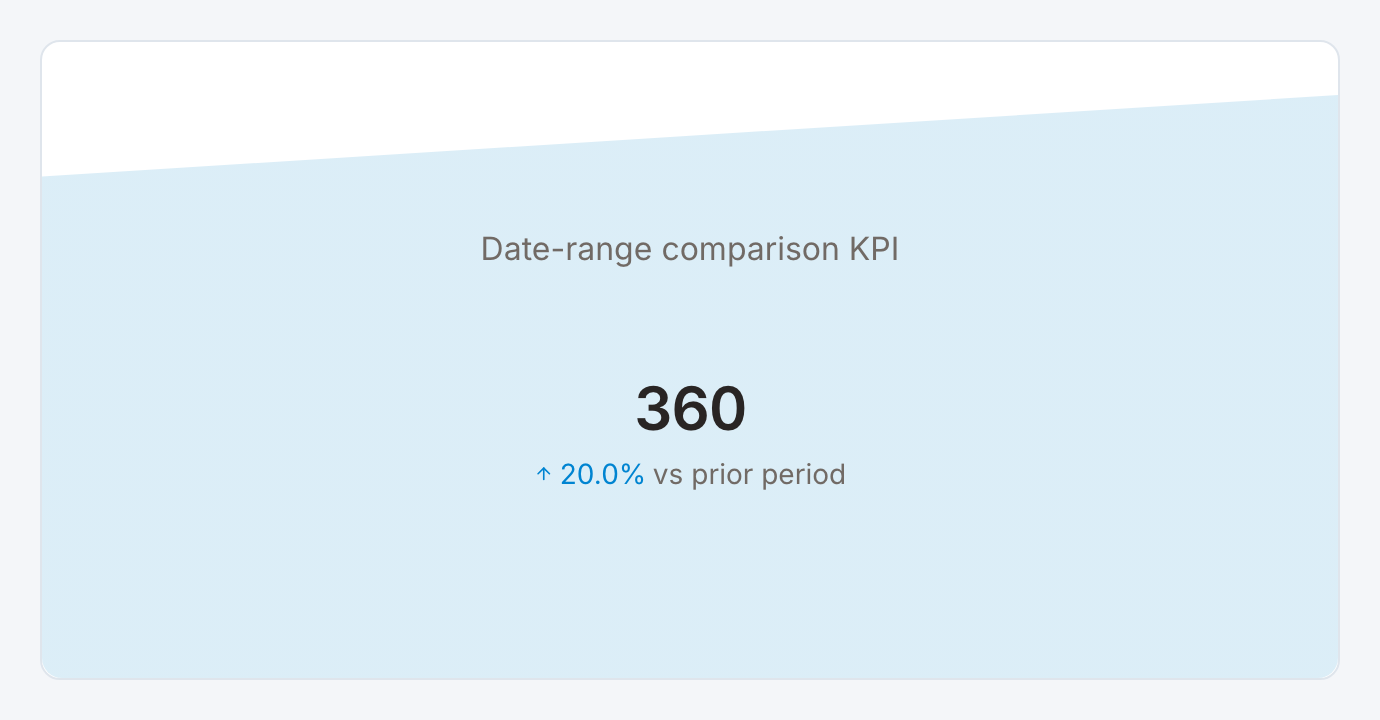
Required data and grain. One row per date, with the numeric measure or ratio components. Keep both the selected window and its prior comparison window.
| Example field | Type | Role in this example |
|---|---|---|
day | ISO date text | Required |
amount | Number | Required |
orders | Number | Optional / available to map |
Optional fields and bindings. orders is extra sample data. Controls support sum, average, last and ratio-of-sums measures and from/to filter bindings.
Example result — first three rows.
day | amount | orders |
|---|---|---|
2026-01-01 | 80 | 8 |
2026-01-02 | 100 | 10 |
2026-01-03 | 120 | 12 |
Download the complete data example. Select this tile to load its preset settings, then use these column names in the visual builder or the example query.
Styling controls. Metric controls set title and value sizes, bold, italic, underline, alignment, number format, prefix, suffix and change label. Choose a plain, custom or performance background and whether lower values are better. Range comparison controls set date field, inclusive start/end, aggregation, comparison window and trend display.
Interactions. Changing bound from/to filters recomputes the card against the prior equal-length window. Automatic cross-filtering is disabled in the starter.
Check before publishing. The starter selects January 4–6 and compares with January 1–3. Selected amount is 360 versus 300, giving 20% change. Missing prior history must not be treated as a genuine zero.
Calendar comparison KPI
Specialized widget · Picker tile calendar-comparison-kpi
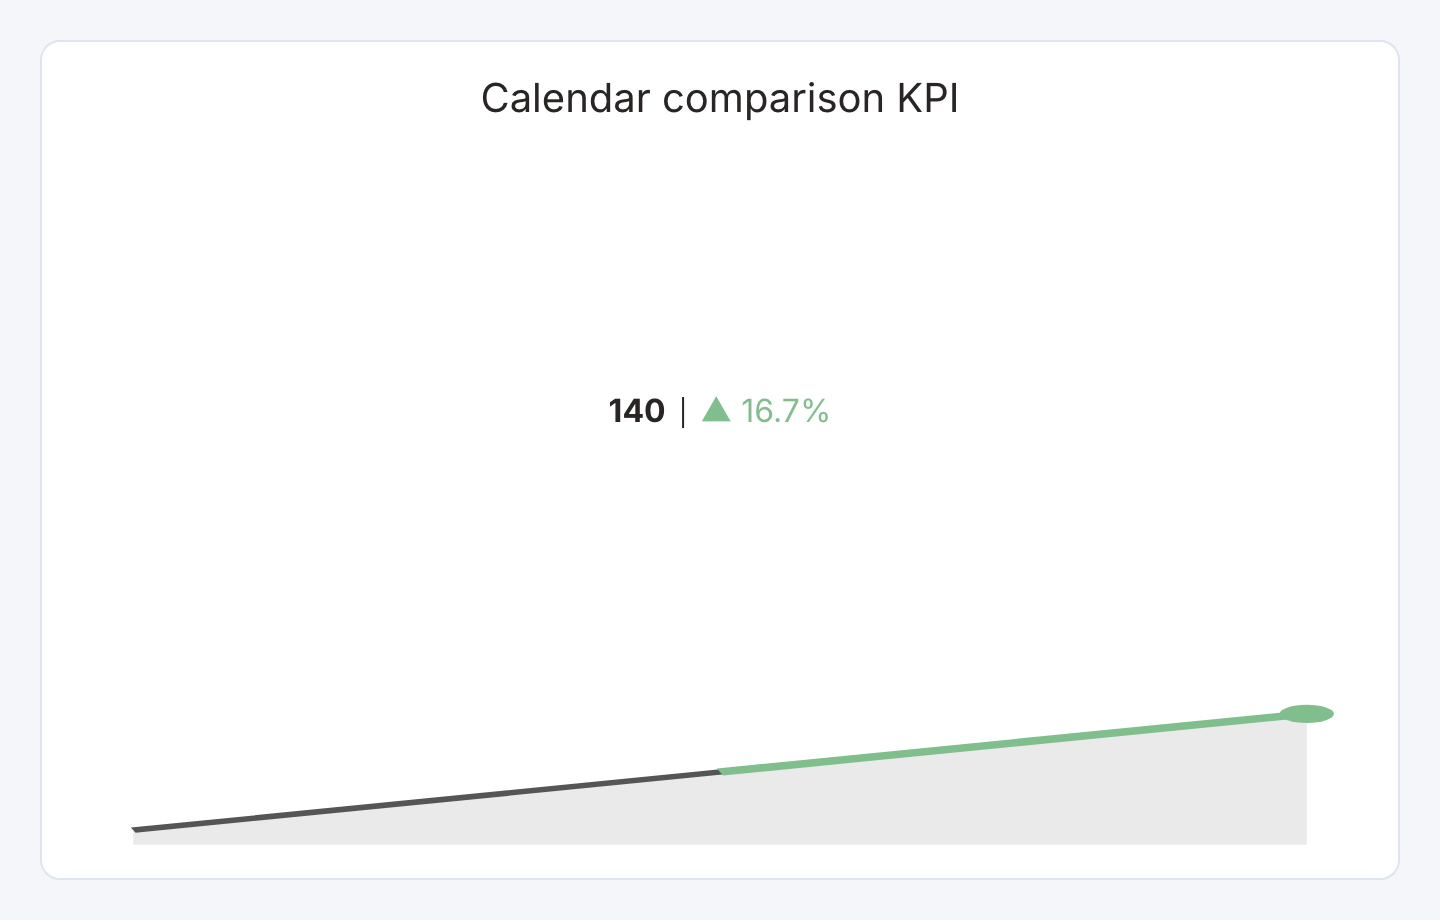
Required data and grain. One row per month, or category and month, with the measure and comparison history.
| Example field | Type | Role in this example |
|---|---|---|
period | ISO date text | Required |
calls | Number | Required |
drops | Number | Optional / available to map |
Optional fields and bindings. drops is an alternative measure. Configure ratio numerator/denominator, year/month/scope filters and full-year values where needed.
Example result.
period | calls | drops |
|---|---|---|
2025-12-01 | 100 | 4 |
2026-01-01 | 120 | 3 |
2026-02-01 | 140 | 3 |
Download the complete data example. Select this tile to load its preset settings, then use these column names in the visual builder or the example query.
Styling controls. Metric controls set title and value sizes, bold, italic, underline, alignment, number format, prefix, suffix and change label. Choose a plain, custom or performance background and whether lower values are better. Calendar controls set date field, measure, comparison scope, complete-period requirement and trend months.
Interactions. Bound year/month/scope filters choose previous month, same month last year, previous quarter or year to date. Automatic cross-filtering is disabled in the starter.
Check before publishing. Blank year/month uses the latest available month. Ratio mode divides sums. Zero or missing denominators and missing required comparison periods are unavailable values.
Period summary KPI
Specialized widget · Picker tile period-kpi
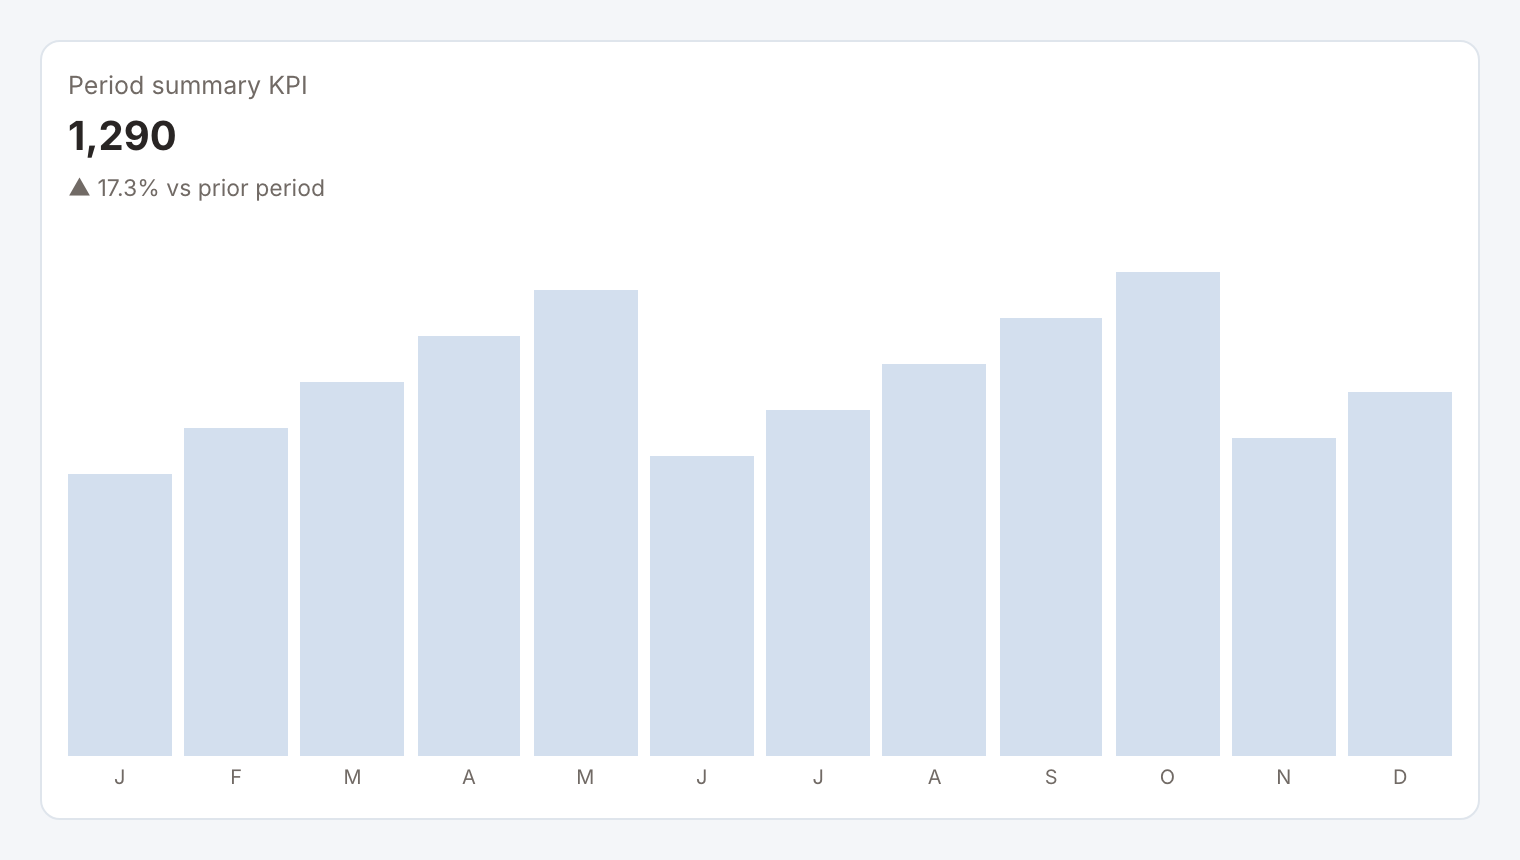
Required data and grain. One row per ordered month, with a trend value and repeated headline and prior values.
| Example field | Type | Role in this example |
|---|---|---|
month | Number | Required |
trend | Number | Required |
value | Number | Required |
previous | Number | Required |
Optional fields and bindings. Period options can bind a month filter and customize period labels.
Example result — first three rows.
month | trend | value | previous |
|---|---|---|---|
1 | 80 | 1290 | 1100 |
2 | 93 | 1290 | 1100 |
3 | 106 | 1290 | 1100 |
Download the complete data example. Select this tile to load its preset settings, then use these column names in the visual builder or the example query.
Styling controls. Metric controls set title and value sizes, bold, italic, underline, alignment, number format, prefix, suffix and change label. Choose a plain, custom or performance background and whether lower values are better. Period summary controls set trend, headline, comparison and period selection.
Interactions. Month controls can select the configured period filter. The normal whole-card category action is not used for this view.
Check before publishing. Monthly trend values are separate from the repeated headline. Do not sum a repeated annual headline once per month.
Utilization rings
Specialized widget · Picker tile utilization-rings
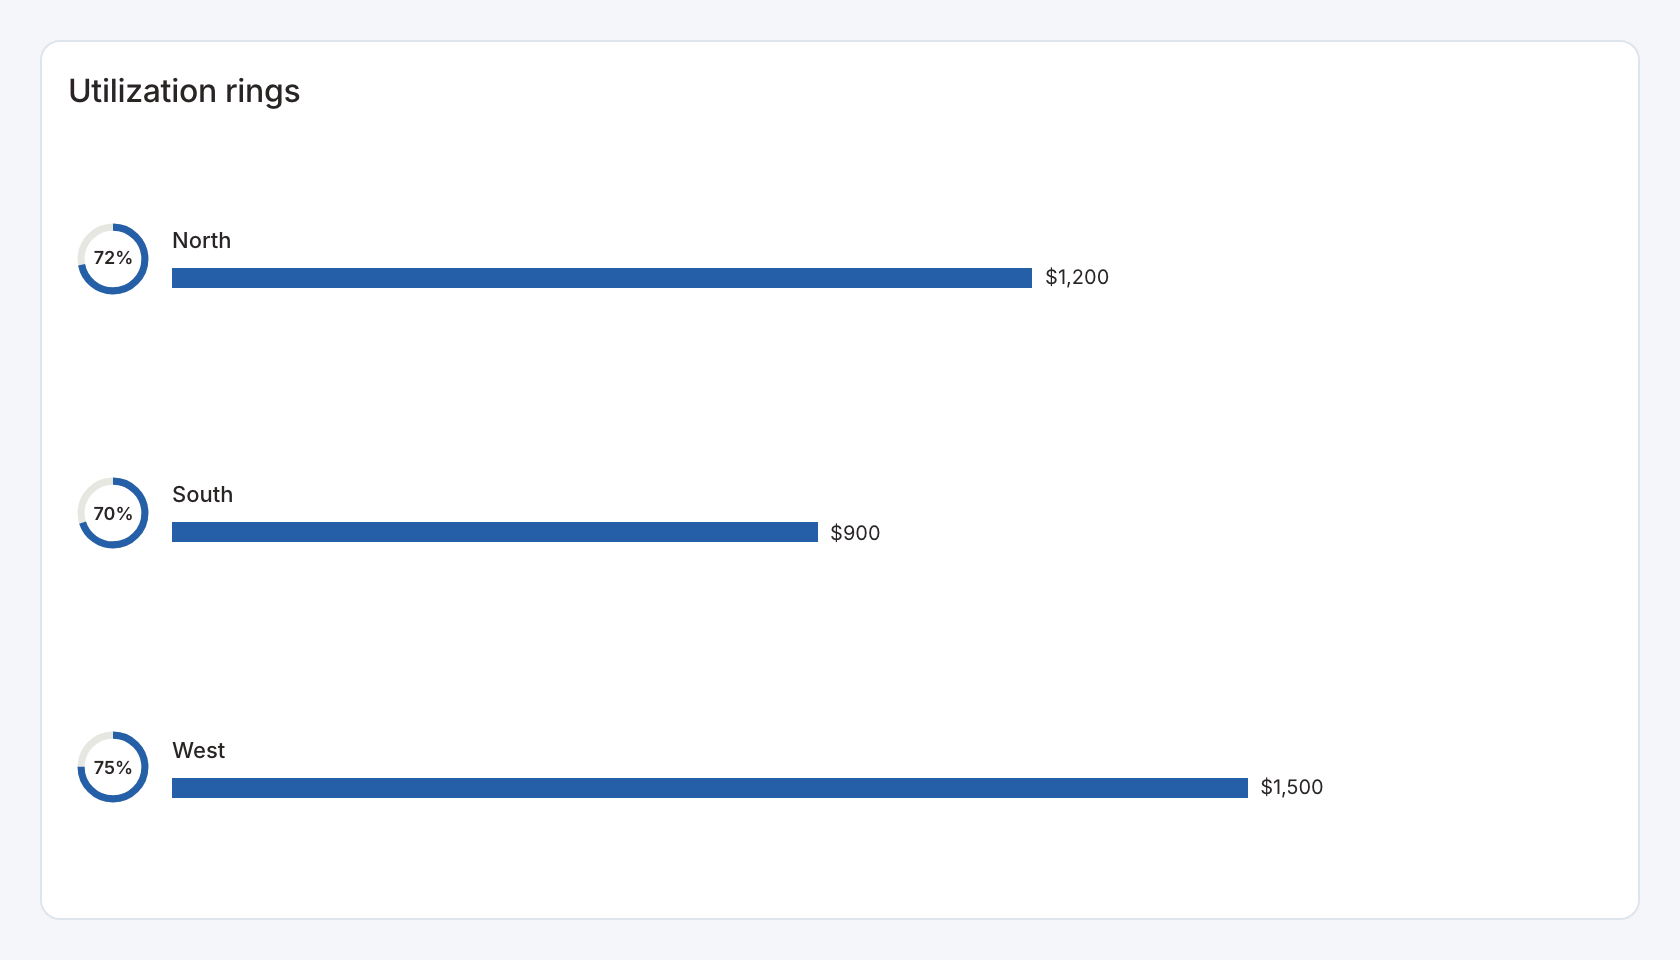
Required data and grain. One row per category, with numeric used and capacity values.
| Example field | Type | Role in this example |
|---|---|---|
category | Text | Required |
used | Number | Required |
capacity | Number | Required |
value | Number | Optional / available to map |
format | Text | Optional / available to map |
Optional fields and bindings. value is an optional displayed secondary measure. format can supply per-row formatting for that display.
Example result.
category | used | capacity | value | format |
|---|---|---|---|---|
North | 72 | 100 | 1200 | currency |
South | 56 | 80 | 900 | currency |
West | 90 | 120 | 1500 | currency |
Download the complete data example. Select this tile to load its preset settings, then use these column names in the visual builder or the example query.
Styling controls. Gauge-list controls set used/capacity bindings, labels, ring colors, number formats and presentation.
Interactions. Select a category control for a configured action.
Check before publishing. Capacity must be positive for a meaningful utilization ratio. The example’s displayed value is separate from the used/capacity ratio.
Composition KPI
Specialized widget · Picker tile proportion-stacked
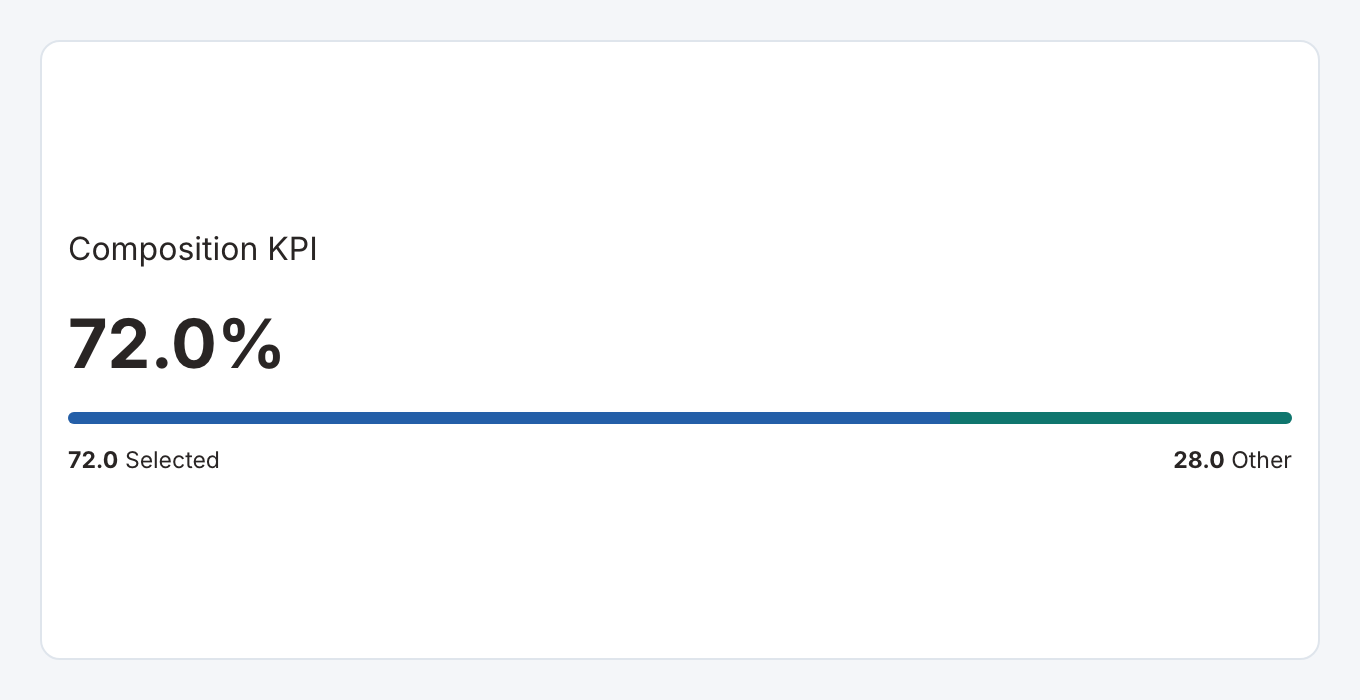
Required data and grain. One result row with a numerator and denominator in the same count or amount unit.
| Example field | Type | Role in this example |
|---|---|---|
selected | Number | Required |
total | Number | Required |
Optional fields and bindings. Configure numerator and complement labels and count visibility.
Example result.
selected | total |
|---|---|
72 | 100 |
Download the complete data example. Select this tile to load its preset settings, then use these column names in the visual builder or the example query.
Styling controls. Proportion controls choose stacked or another supported display, colors, labels and counts. Metric controls set number format and typography.
Interactions. This view displays a ratio and its complement. It does not emit selections from individual segments.
Check before publishing. The sample is 72/100, giving 72% selected and 28% other. A zero denominator is unavailable, and a numerator outside the denominator needs a clear business explanation.
Proportion marker KPI
Specialized widget · Picker tile proportion-marker
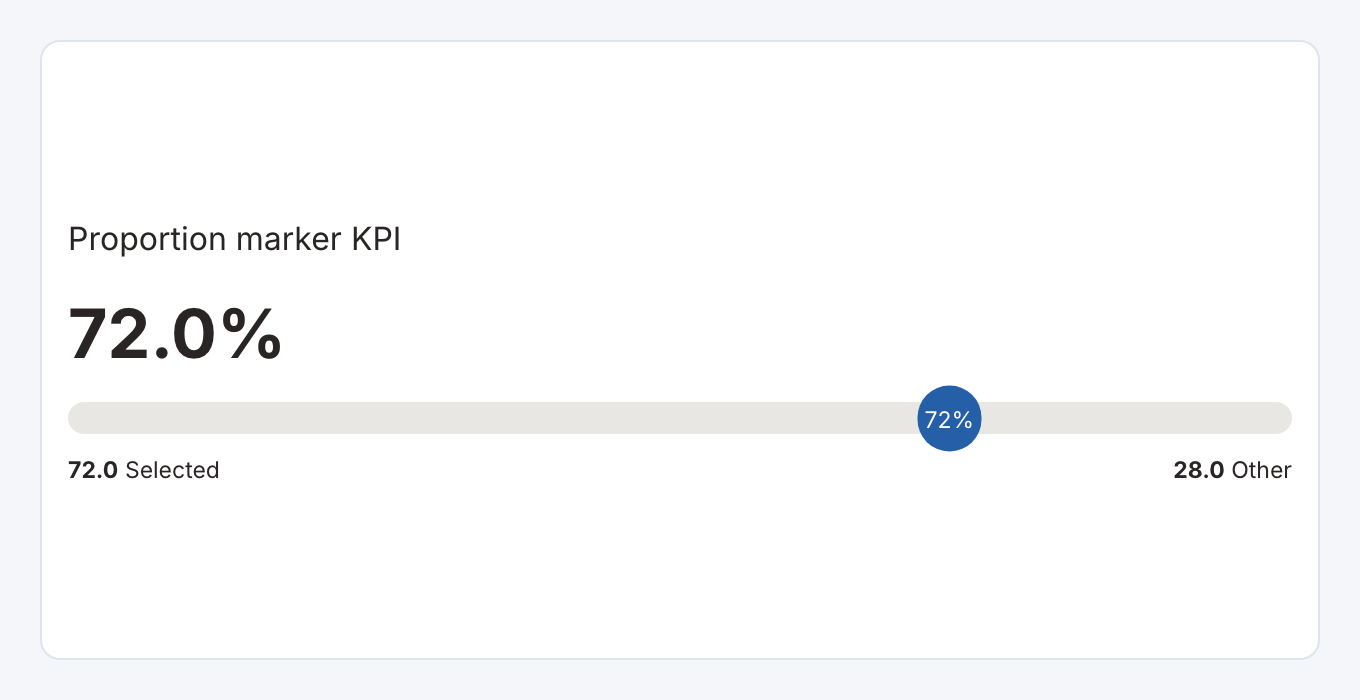
Required data and grain. One result row with a numerator and denominator in the same count or amount unit.
| Example field | Type | Role in this example |
|---|---|---|
selected | Number | Required |
total | Number | Required |
Optional fields and bindings. Configure numerator and complement labels and count visibility.
Example result.
selected | total |
|---|---|
72 | 100 |
Download the complete data example. Select this tile to load its preset settings, then use these column names in the visual builder or the example query.
Styling controls. Proportion controls choose marker or another supported display, colors, labels and counts. Metric controls set number format and typography.
Interactions. This view displays a ratio and its complement. It does not emit selections from individual segments.
Check before publishing. The sample is 72/100, giving 72% selected and 28% other. A zero denominator is unavailable, and a numerator outside the denominator needs a clear business explanation.
Proportion ring KPI
Specialized widget · Picker tile proportion-ring
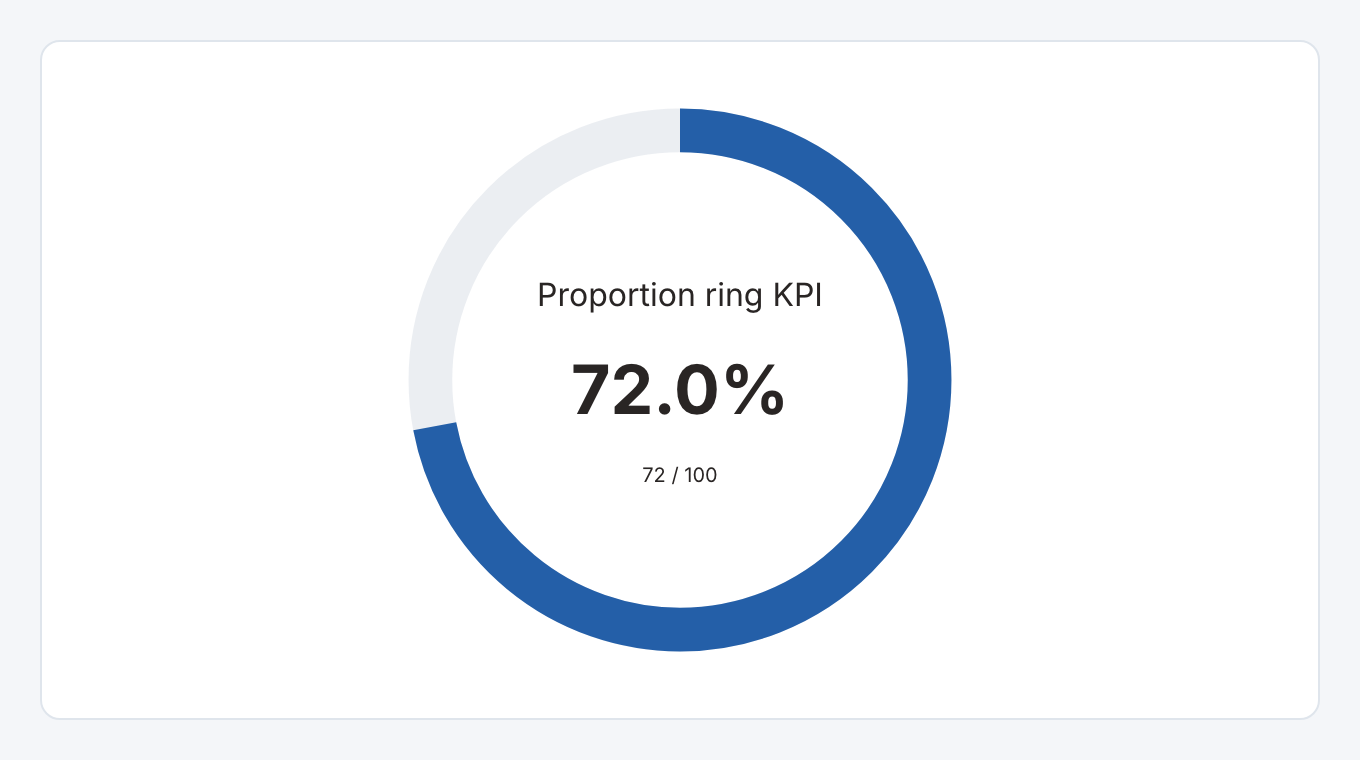
Required data and grain. One result row with a numerator and denominator in the same count or amount unit.
| Example field | Type | Role in this example |
|---|---|---|
selected | Number | Required |
total | Number | Required |
Optional fields and bindings. Configure numerator and complement labels and count visibility.
Example result.
selected | total |
|---|---|
72 | 100 |
Download the complete data example. Select this tile to load its preset settings, then use these column names in the visual builder or the example query.
Styling controls. Proportion controls choose ring or another supported display, colors, labels and counts. Metric controls set number format and typography.
Interactions. This view displays a ratio and its complement. It does not emit selections from individual segments.
Check before publishing. The sample is 72/100, giving 72% selected and 28% other. A zero denominator is unavailable, and a numerator outside the denominator needs a clear business explanation.
Background sparkline KPI
Specialized widget · Picker tile background-kpi
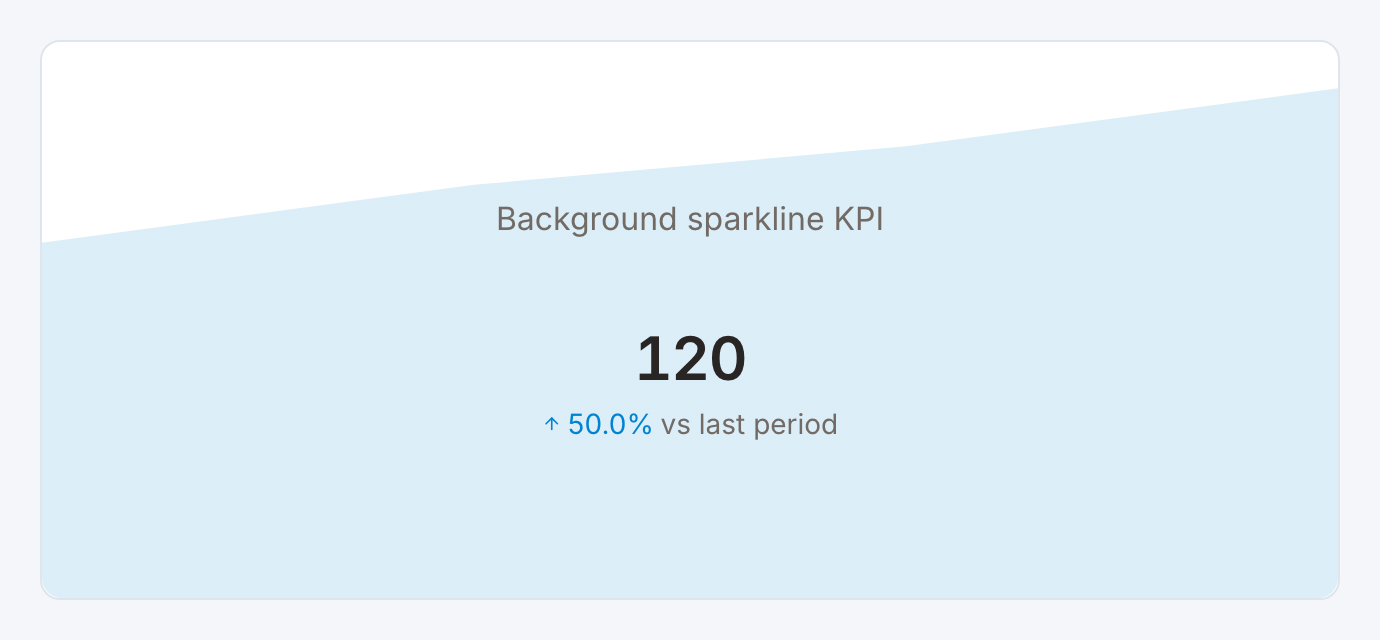
Required data and grain. Ordered trend rows, with repeated headline and prior values plus the sparkline measure.
| Example field | Type | Role in this example |
|---|---|---|
year | Number | Optional / available to map |
trend | Number | Required |
value | Number | Required |
previous | Number | Required |
reference_year | Number | Optional / available to map |
Optional fields and bindings. year is optional trend context in the example. Bind a stable category key for card actions.
Example result — first three rows.
year | trend | value | previous | reference_year |
|---|---|---|---|---|
2023 | 80 | 120 | 80 | 2023 |
2024 | 95 | 120 | 80 | 2023 |
2025 | 105 | 120 | 80 | 2023 |
Download the complete data example. Select this tile to load its preset settings, then use these column names in the visual builder or the example query.
Styling controls. Metric controls set title and value sizes, bold, italic, underline, alignment, number format, prefix, suffix and change label. Choose a plain, custom or performance background and whether lower values are better. Set background sparkline style and a custom or performance background color.
Interactions. With an explicit filter action and its source column present in the first result row, the whole card can select that row’s value. A total-only result needs a separate category or key column to act as a category filter.
Check before publishing. The sparkline fills the card background. Keep foreground text legible and repeat the headline value consistently across trend rows.
Split trend KPI
Specialized widget · Picker tile split-kpi
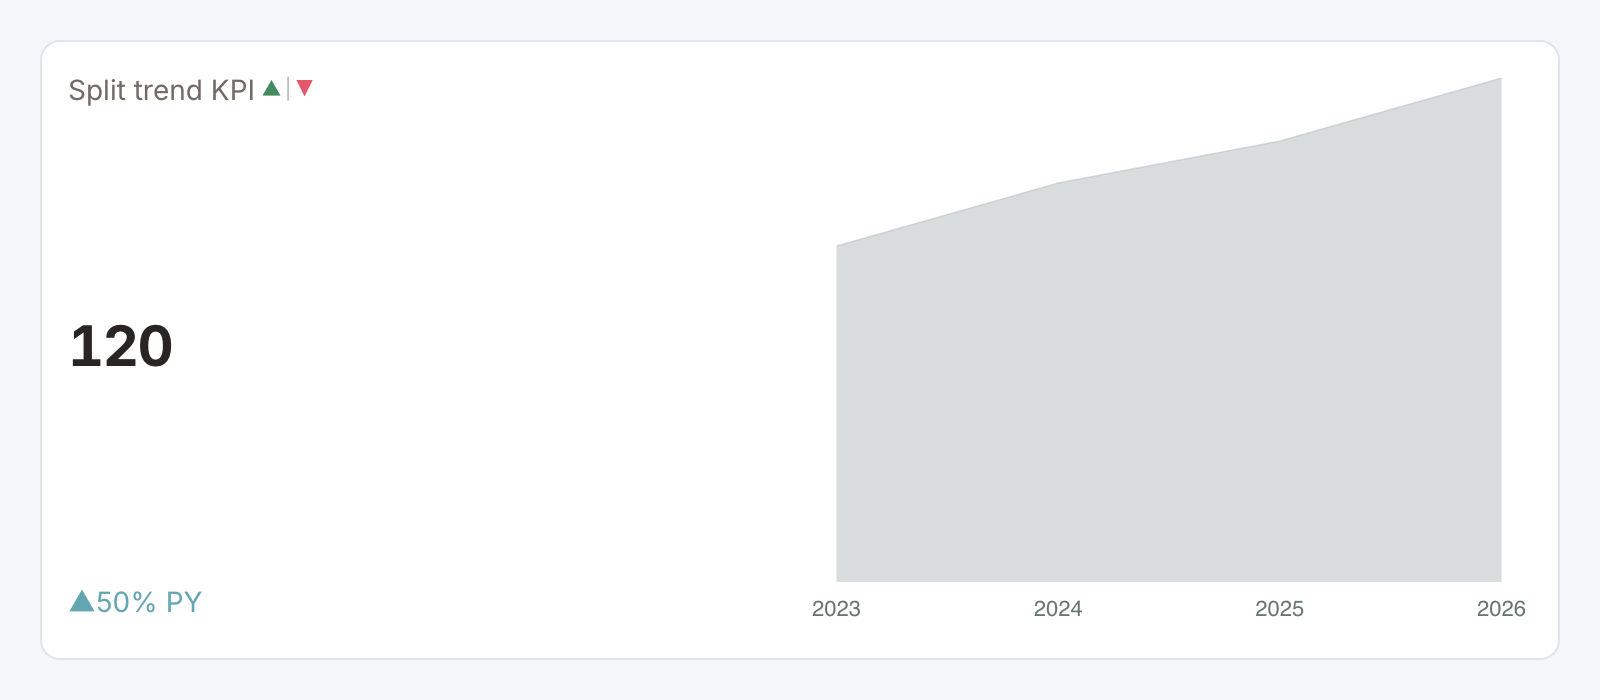
Required data and grain. Ordered trend rows, with repeated headline and prior values, a trend value and trend x label.
| Example field | Type | Role in this example |
|---|---|---|
year | Number | Required |
trend | Number | Required |
value | Number | Required |
previous | Number | Required |
reference_year | Number | Optional / available to map |
Optional fields and bindings. A comparison series can be added where the selected layout supports it.
Example result — first three rows.
year | trend | value | previous | reference_year |
|---|---|---|---|---|
2023 | 80 | 120 | 80 | 2023 |
2024 | 95 | 120 | 80 | 2023 |
2025 | 105 | 120 | 80 | 2023 |
Download the complete data example. Select this tile to load its preset settings, then use these column names in the visual builder or the example query.
Styling controls. Metric controls set title and value sizes, bold, italic, underline, alignment, number format, prefix, suffix and change label. Choose a plain, custom or performance background and whether lower values are better. Choose split-trend layout, left alignment, trend type, trend labels and spacing.
Interactions. With an explicit filter action and its source column present in the first result row, the whole card can select that row’s value. A total-only result needs a separate category or key column to act as a category filter.
Check before publishing. This layout places a compact trend beside the metric, similar to the Udemy-style KPI. The first row supplies the headline and comparison.
Benchmark trend KPI
Specialized widget · Picker tile panel-kpi
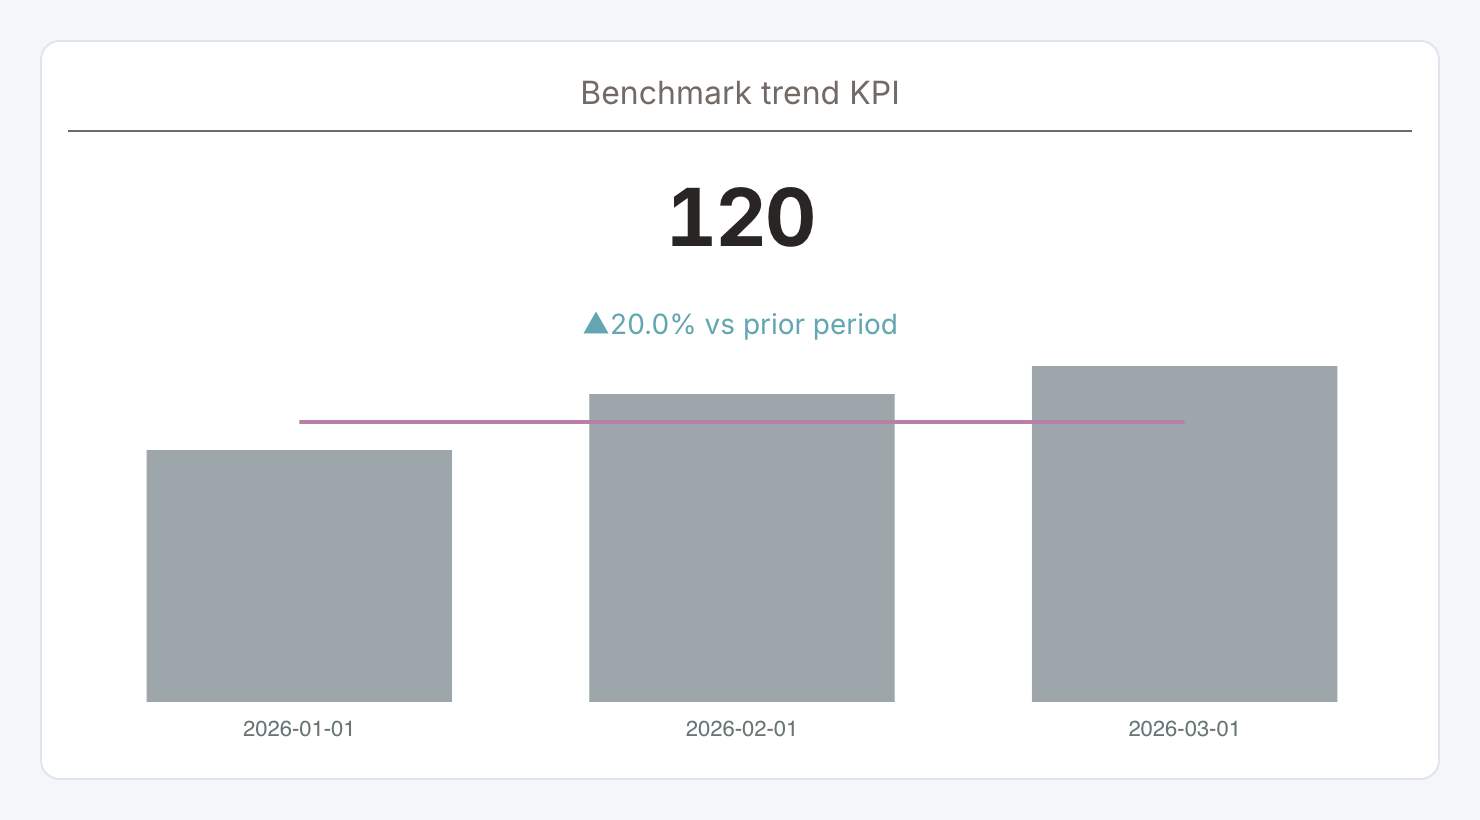
Required data and grain. Ordered trend rows, with repeated headline/prior values, trend x labels, trend and benchmark values.
| Example field | Type | Role in this example |
|---|---|---|
month | ISO date text | Required |
trend | Number | Required |
benchmark | Number | Required |
value | Number | Required |
previous | Number | Required |
Optional fields and bindings. Benchmark is optional when no comparison trend is shown.
Example result.
month | trend | benchmark | value | previous |
|---|---|---|---|---|
2026-01-01 | 90 | 100 | 120 | 100 |
2026-02-01 | 110 | 100 | 120 | 100 |
2026-03-01 | 120 | 100 | 120 | 100 |
Download the complete data example. Select this tile to load its preset settings, then use these column names in the visual builder or the example query.
Styling controls. Metric controls set title and value sizes, bold, italic, underline, alignment, number format, prefix, suffix and change label. Choose a plain, custom or performance background and whether lower values are better. Choose panel-trend layout, bar or line trend, comparison field, date-label format and direction-key visibility.
Interactions. With an explicit filter action and its source column present in the first result row, the whole card can select that row’s value. A total-only result needs a separate category or key column to act as a category filter.
Check before publishing. Headline and trend values can use different grains. Label the period and benchmark so the relationship is clear.
Secondary value KPI
Specialized widget · Picker tile secondary-kpi
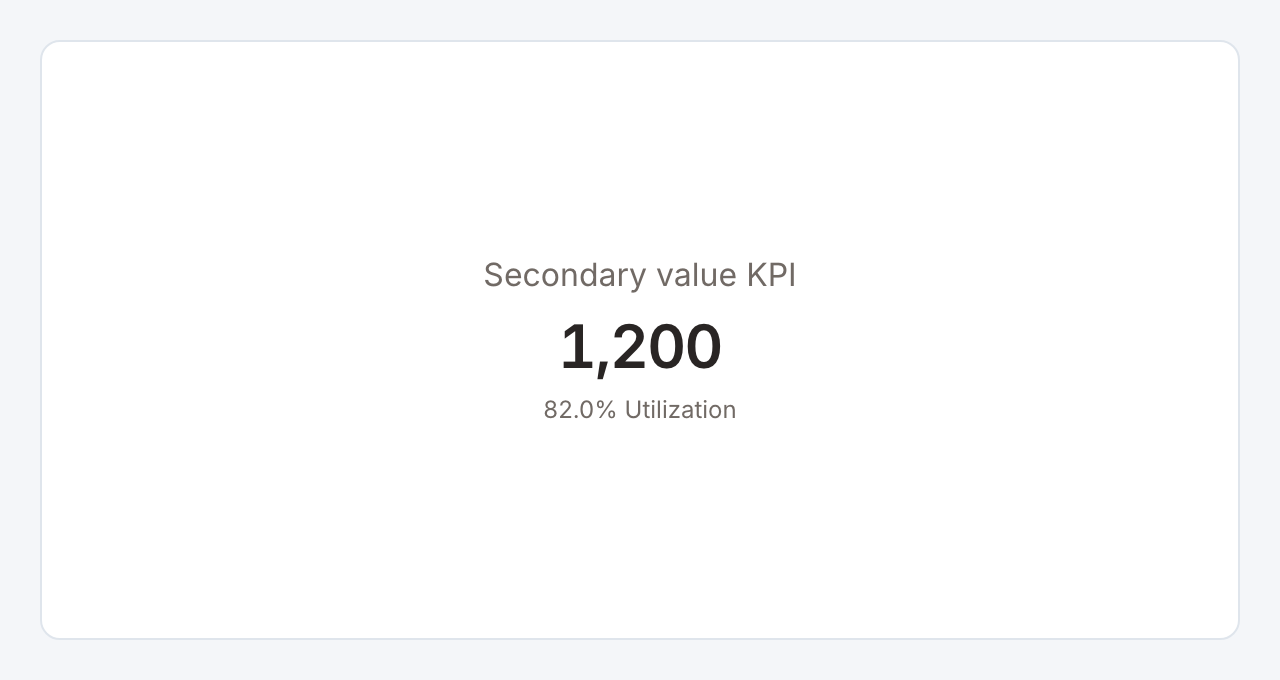
Required data and grain. One result row with a main numeric value and a separate secondary numeric value.
| Example field | Type | Role in this example |
|---|---|---|
value | Number | Required |
secondary | Number | Required |
Optional fields and bindings. Optional prior and sparkline mappings add comparison context.
Example result.
value | secondary |
|---|---|
1200 | 0.82 |
Download the complete data example. Select this tile to load its preset settings, then use these column names in the visual builder or the example query.
Styling controls. Metric controls set title and value sizes, bold, italic, underline, alignment, number format, prefix, suffix and change label. Choose a plain, custom or performance background and whether lower values are better. Set the secondary label and its independent number format.
Interactions. With an explicit filter action and its source column present in the first result row, the whole card can select that row’s value. A total-only result needs a separate category or key column to act as a category filter.
Check before publishing. The sample secondary value 0.82 is displayed as 82.0% and is independent of the main value 1200.
Spiral gauge
Specialized widget · Picker tile spiral-gauge
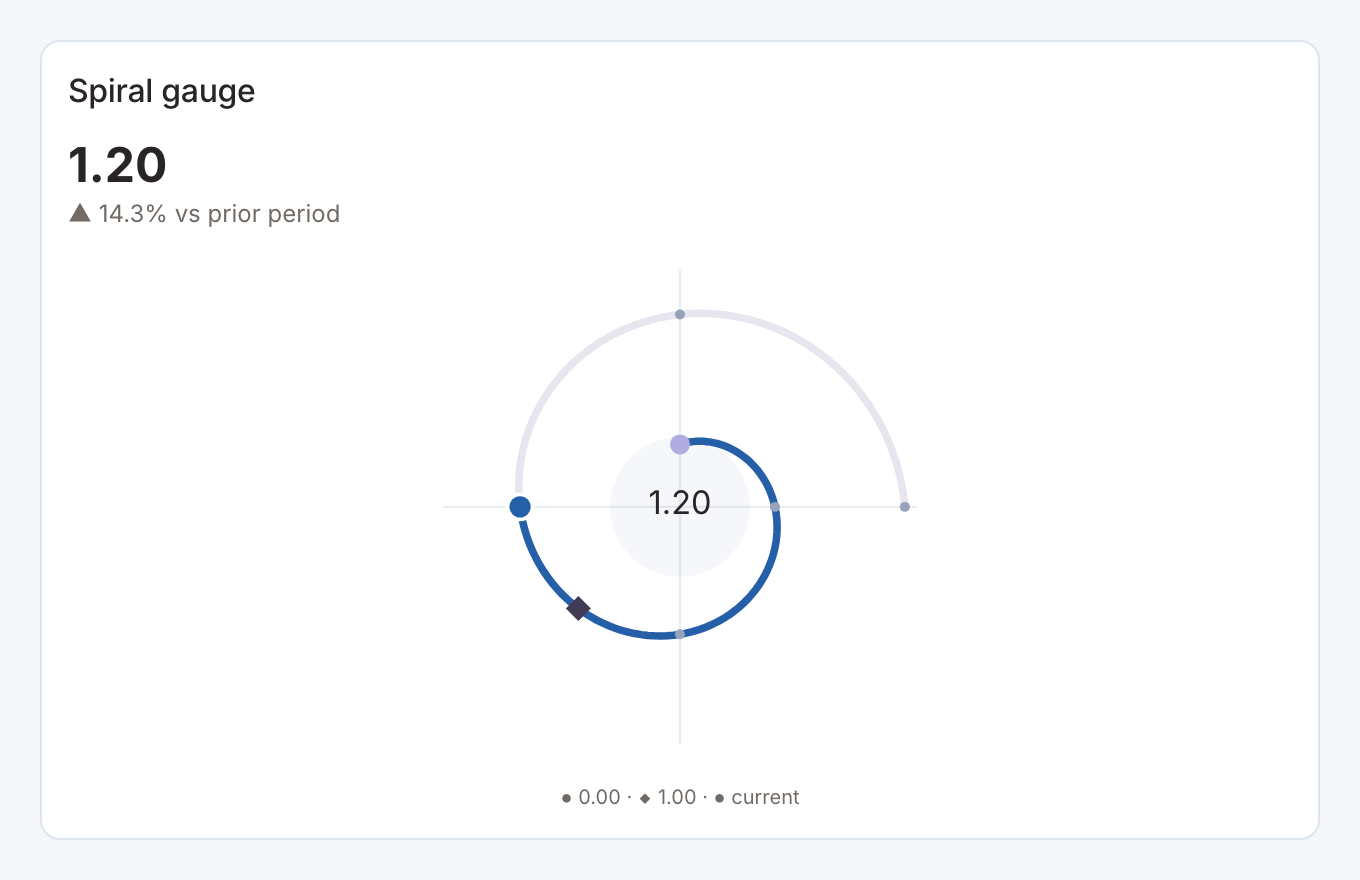
Required data and grain. One row with current numeric value and optional prior value.
| Example field | Type | Role in this example |
|---|---|---|
value | Number | Required |
previous | Number | Optional / available to map |
Optional fields and bindings. previous adds comparison context. Configure minimum, maximum and target in the same unit.
Example result.
value | previous |
|---|---|
1.2 | 1.05 |
Download the complete data example. Select this tile to load its preset settings, then use these column names in the visual builder or the example query.
Styling controls. Gauge controls choose spiral layout, range, target, colors and value format. Metric controls provide comparison formatting.
Interactions. Hover for values where a tooltip is shown. This renderer does not send mark selections to dashboard filters or drill-through.
Check before publishing. The starter range is 0–2 with target 1, not a 0–100 percentage scale.
Semicircle gauge
Specialized widget · Picker tile semicircle-gauge
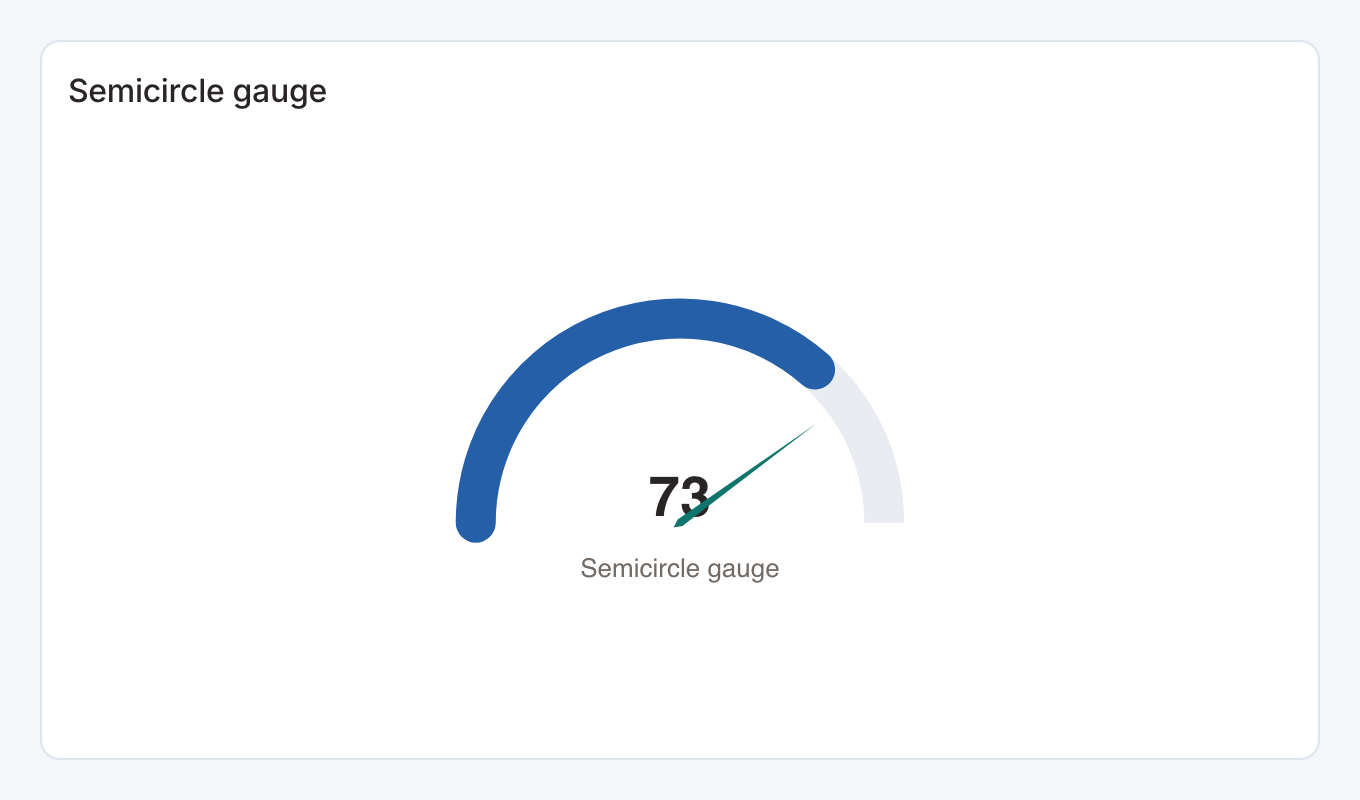
Required data and grain. One row with a numeric current value in the first column.
| Example field | Type | Role in this example |
|---|---|---|
value | Number | Required |
Optional fields and bindings. Set minimum, maximum and target in the gauge controls.
Example result.
value |
|---|
73 |
Download the complete data example. Select this tile to load its preset settings, then use these column names in the visual builder or the example query.
Styling controls. Choose semicircle layout, range, target marker, colors, labels and value format.
Interactions. Hover for values where a tooltip is shown. This renderer does not send mark selections to dashboard filters or drill-through.
Check before publishing. The starter has range 0–100, target 80 and current value 73. Use the same unit for all three.