Trends and calendars
Time series, calendar layouts, time comparisons and schedules.
Open Add widget and choose the exact tile name below. Standard tiles use a base renderer. Specialized widget tiles preload that renderer’s specialized view, field mappings and starter data. Both are editable in Studio. Read the shared data, styling and interaction guide before replacing starter data.
Screenshots. These are real Studio widgets with fictional sample data and example settings. Colors, labels and layout remain configurable. Select an image to view it at full size.
Line
Standard · Picker tile line_chart
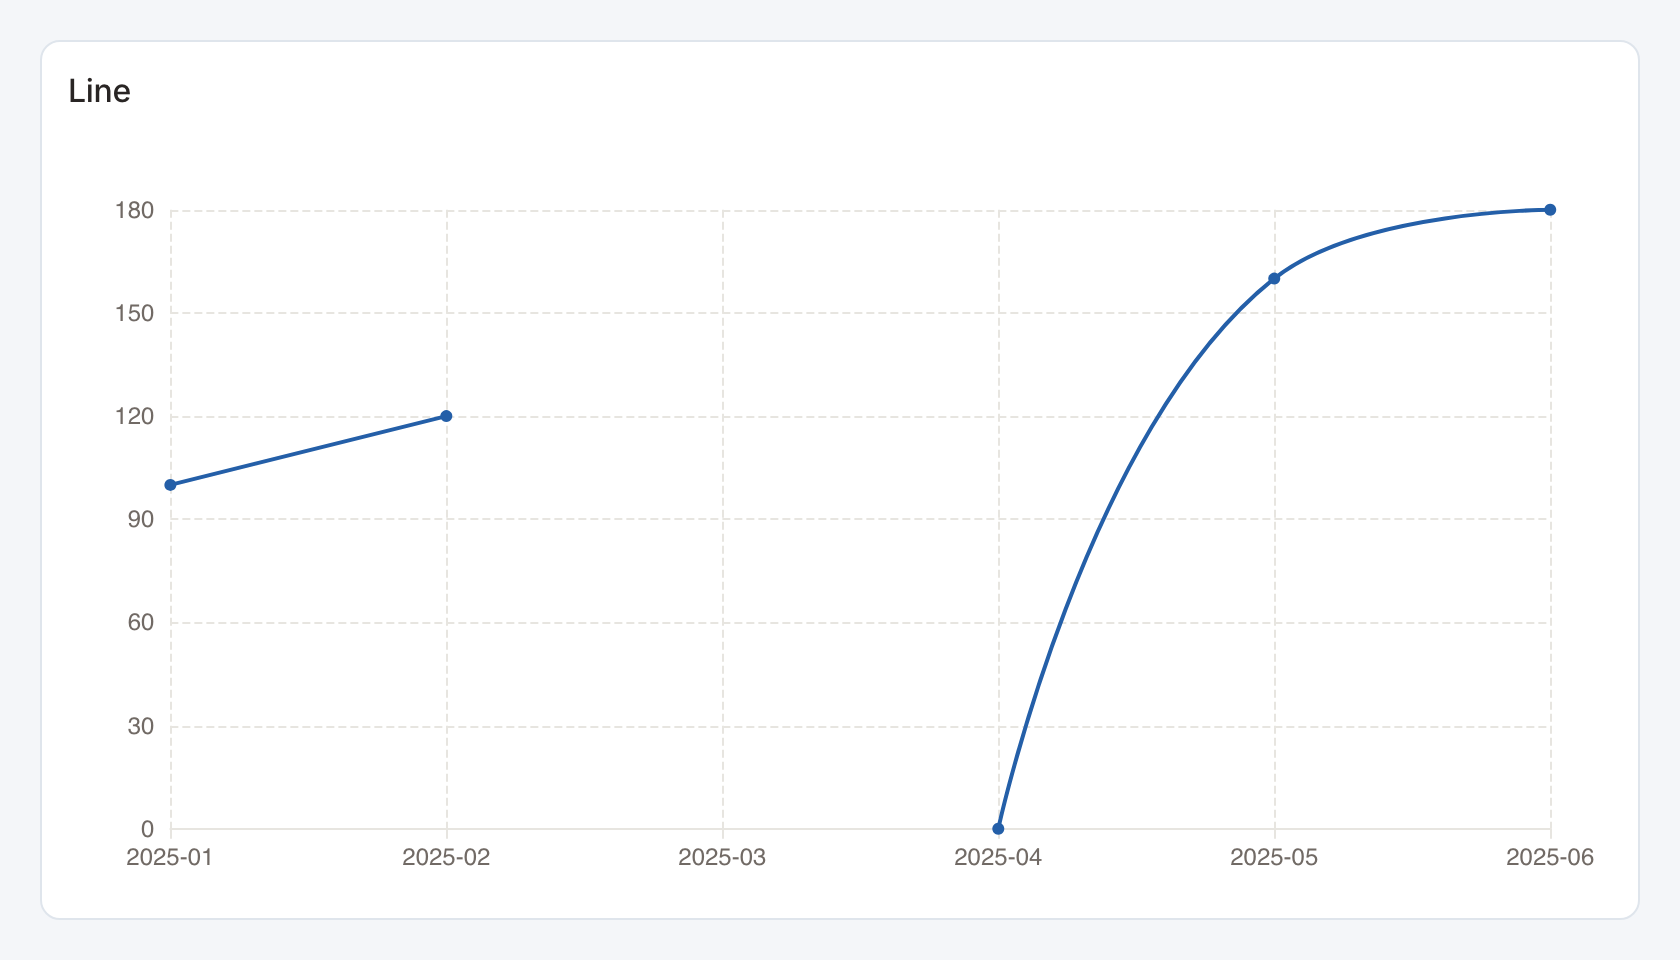
Required data and grain. Wide form, one row per x-axis bucket in display order. The first column is the bucket and subsequent numeric columns are series.
| Example field | Type | Role in this example |
|---|---|---|
month | Text | Required |
revenue | Number | Required |
Optional fields and bindings. Add more numeric measure columns for additional series. Missing or invalid numeric cells remain gaps. An actual numeric zero stays zero. In this example March is missing and April is an observed zero.
Example result — first three rows.
month | revenue |
|---|---|
2025-01 | 100 |
2025-02 | 120 |
2025-03 | — |
Download the complete data example. Select this tile to load its preset settings, then use these column names in the visual builder or the example query.
Styling controls. Choose colors, legend, points, labels and grid visibility. Axis controls set titles, label rotation, ranges and number formats. Series controls customize supported line and bar series. Area fills apply to the Area tile.
Interactions. Hover for series values, toggle visible series in the legend, and select an x-axis bucket for a configured filter or drill-through action.
Check before publishing. Sort dates in the data source. Use Grouped time series for long form data with a separate series column.
Area
Standard · Picker tile area_chart
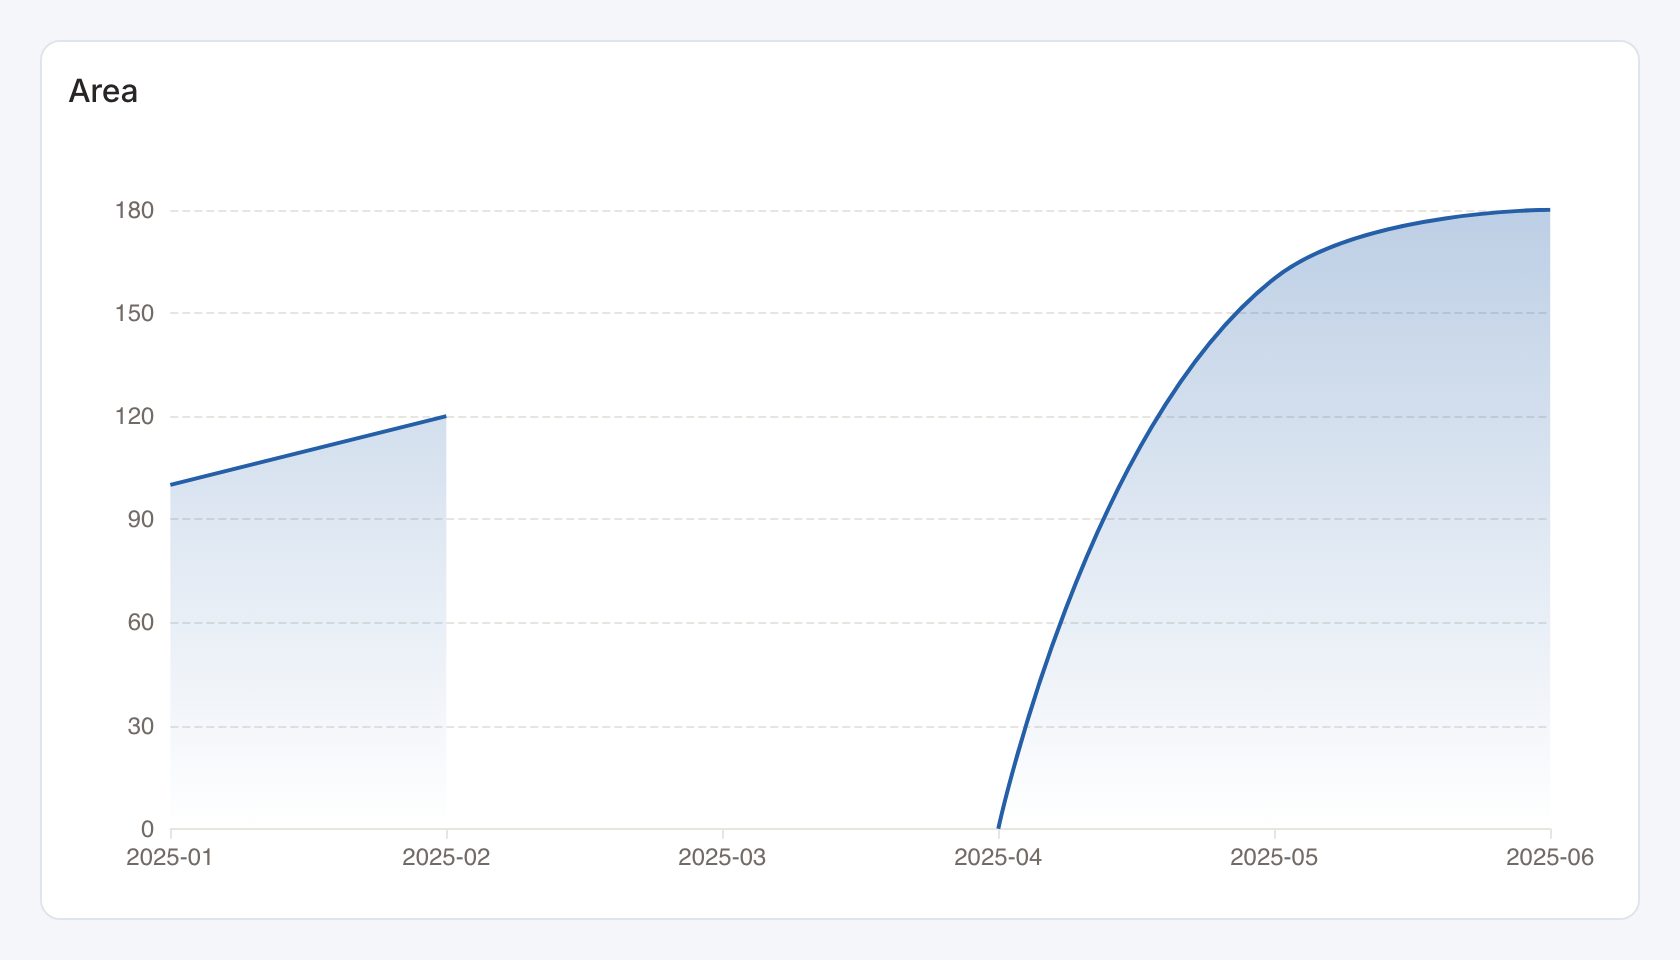
Required data and grain. Wide form, one row per x-axis bucket in display order. The first column is the bucket and subsequent numeric columns are series.
| Example field | Type | Role in this example |
|---|---|---|
month | Text | Required |
revenue | Number | Required |
Optional fields and bindings. Add more numeric measure columns for additional series. Missing or invalid numeric cells remain gaps. An actual numeric zero stays zero. In this example March is missing and April is an observed zero.
Example result — first three rows.
month | revenue |
|---|---|
2025-01 | 100 |
2025-02 | 120 |
2025-03 | — |
Download the complete data example. Select this tile to load its preset settings, then use these column names in the visual builder or the example query.
Styling controls. Choose colors, legend, points, labels and grid visibility. Axis controls set titles, label rotation, ranges and number formats. Series controls customize supported line and bar series. Area fills apply to the Area tile.
Interactions. Hover for series values, toggle visible series in the legend, and select an x-axis bucket for a configured filter or drill-through action.
Check before publishing. Sort dates in the data source. Use Grouped time series for long form data with a separate series column.
Candlestick
Standard · Picker tile candlestick
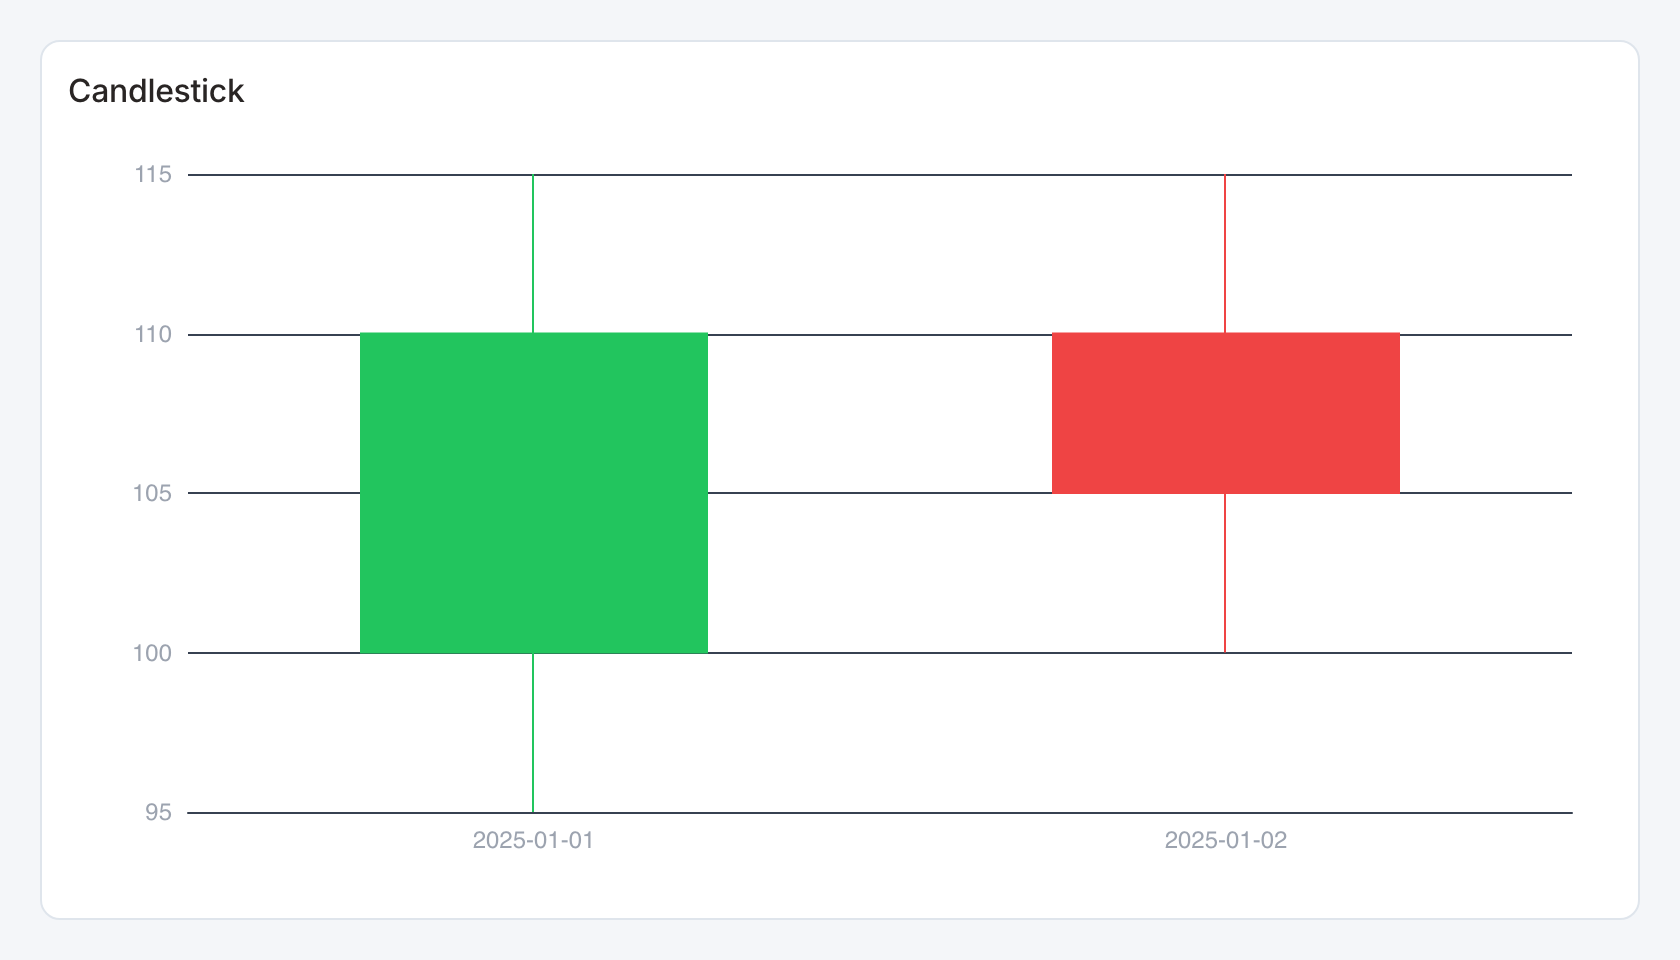
Required data and grain. One row per ordered date. Columns are date, open, close, low and high.
| Example field | Type | Role in this example |
|---|---|---|
date | ISO date text | Required |
open | Number | Required |
close | Number | Required |
low | Number | Required |
high | Number | Required |
Optional fields and bindings. Use one consistent price or measurement unit.
Example result.
date | open | close | low | high |
|---|---|---|---|---|
2025-01-01 | 100 | 110 | 95 | 115 |
2025-01-02 | 110 | 105 | 100 | 115 |
Download the complete data example. Select this tile to load its preset settings, then use these column names in the visual builder or the example query.
Styling controls. Set colors, axis labels, grid and numeric format. Allow enough width to distinguish adjacent candles.
Interactions. Hover for values where a tooltip is shown. This renderer does not send mark selections to dashboard filters or drill-through.
Check before publishing. The column order places close before low and high. Ensure low ≤ open/close ≤ high.
Calendar
Standard · Picker tile calendar
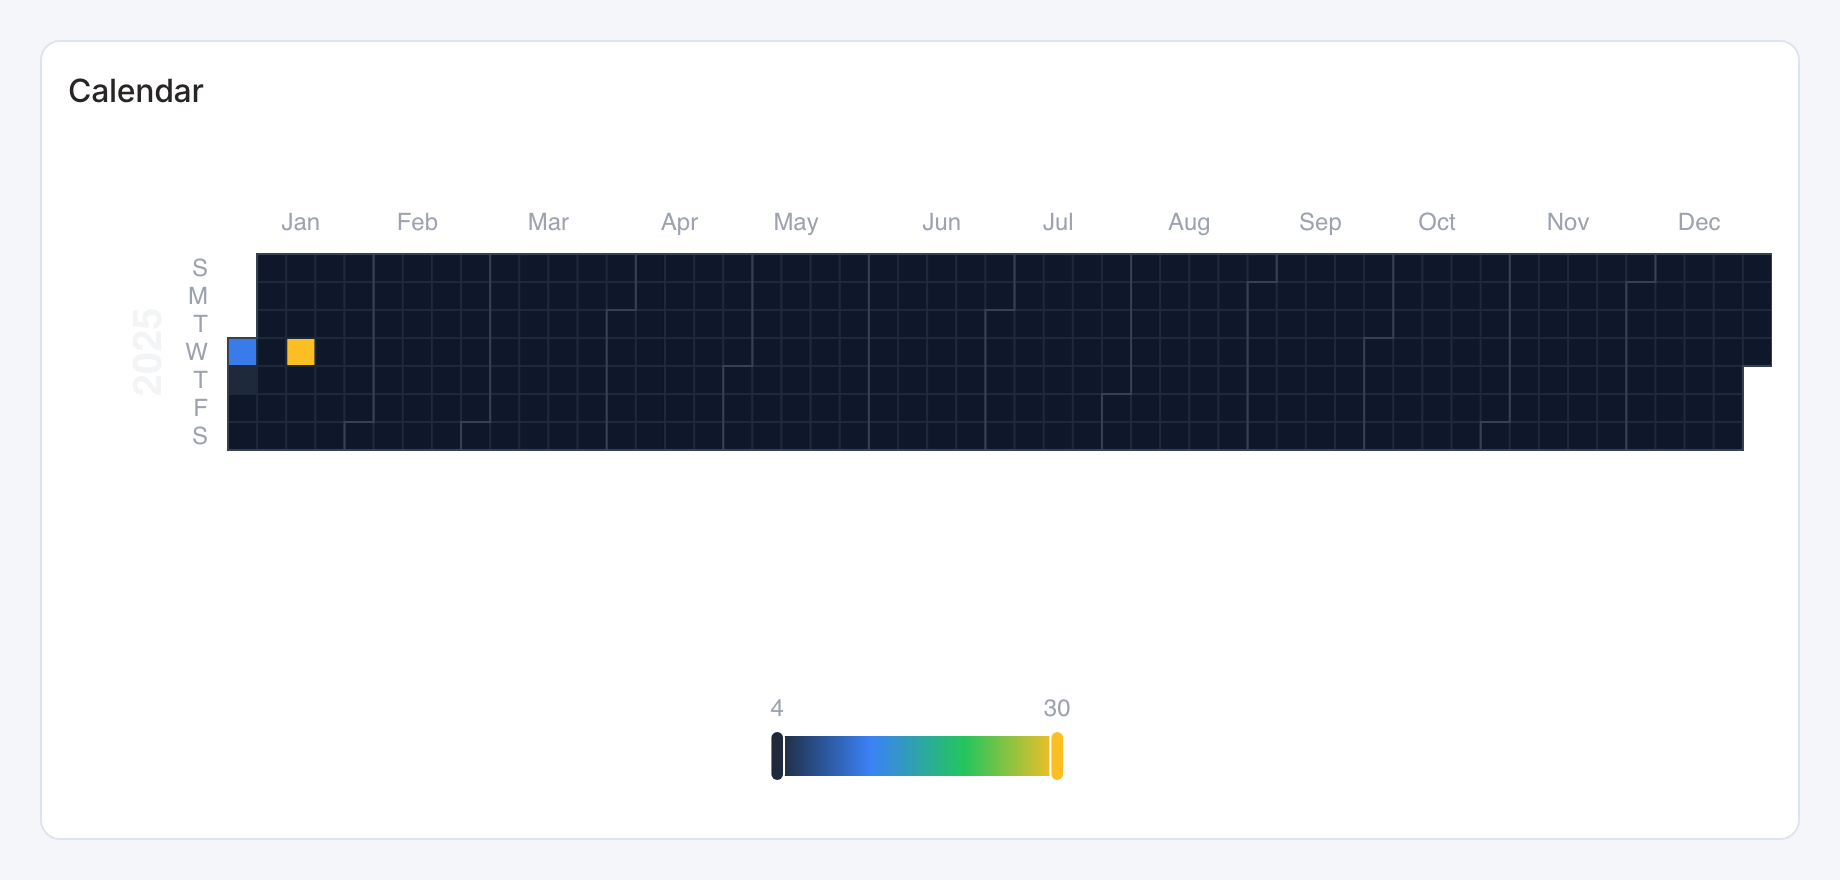
Required data and grain. One row per date and numeric value. The first column must contain date strings in YYYY-MM-DD form.
| Example field | Type | Role in this example |
|---|---|---|
date | ISO date text | Required |
value | Number | Required |
Optional fields and bindings. Aggregate duplicate dates before rendering and keep zero-valued days when zero is meaningful.
Example result.
date | value |
|---|---|
2025-01-01 | 12 |
2025-01-02 | 4 |
2025-01-15 | 30 |
Download the complete data example. Select this tile to load its preset settings, then use these column names in the visual builder or the example query.
Styling controls. Set palette and labels. Provide enough height for calendar cells and the value key.
Interactions. Hover for values where a tooltip is shown. This renderer does not send mark selections to dashboard filters or drill-through.
Check before publishing. Use a selectable calendar preset for dashboard date actions, daily details or a multi-month layout.
Theme River
Standard · Picker tile theme_river
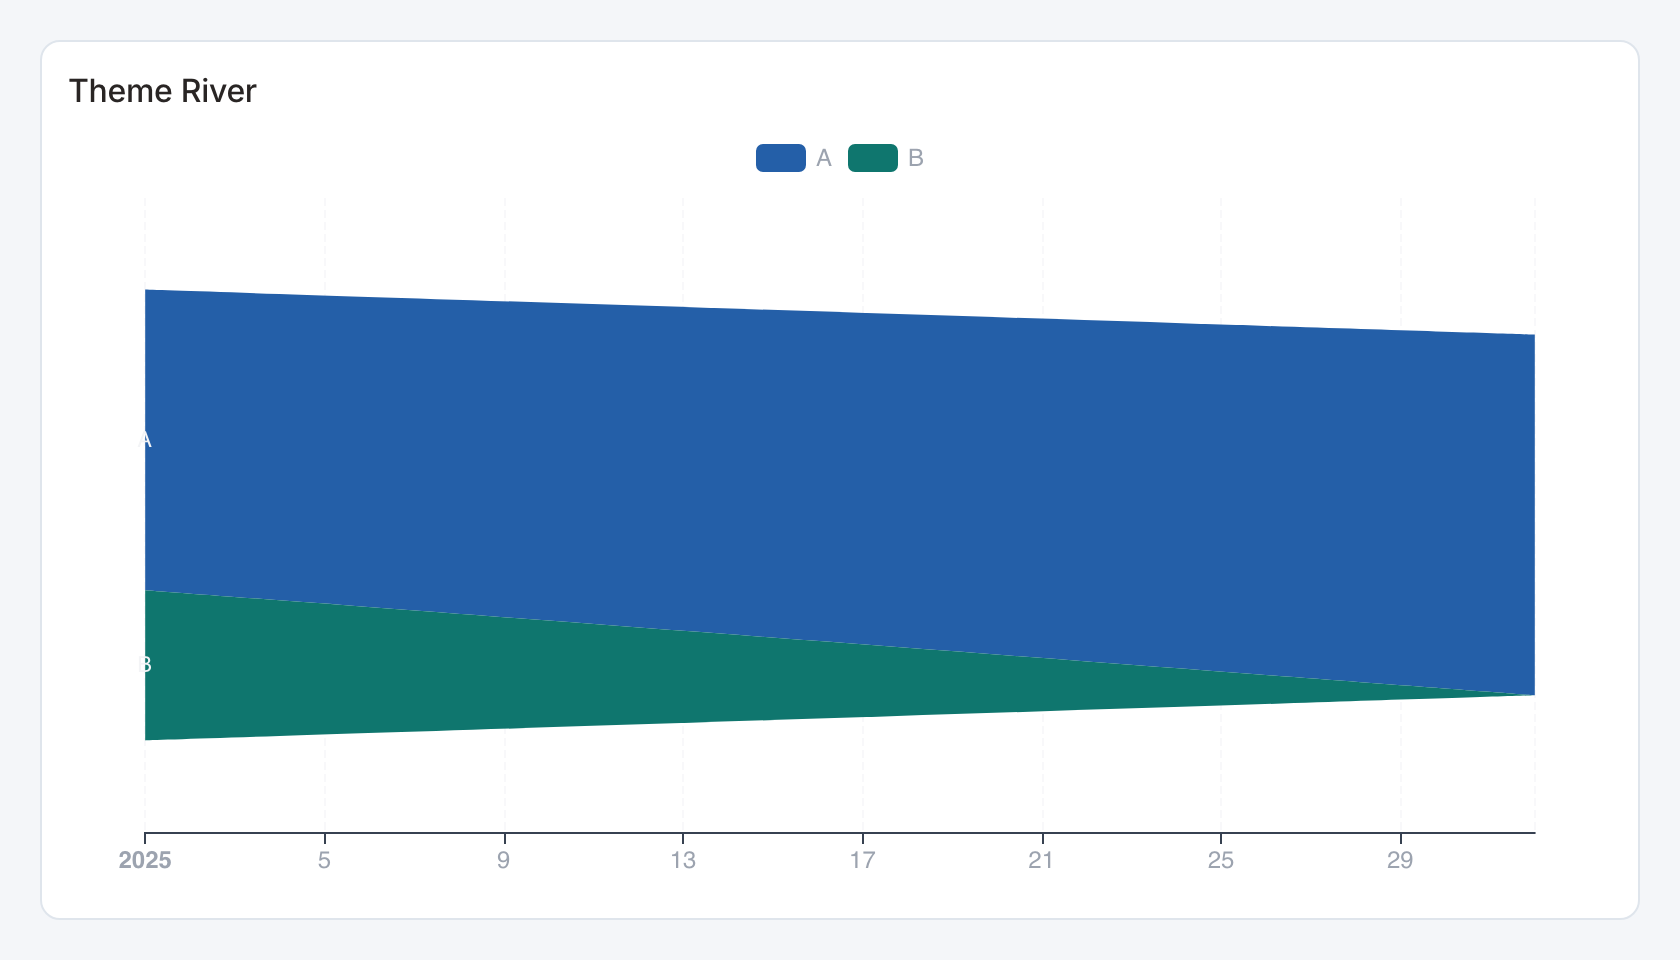
Required data and grain. Long form, one row per time bucket and category. Columns are time, category and numeric magnitude.
| Example field | Type | Role in this example |
|---|---|---|
date | Text | Required |
category | Text | Required |
value | Number | Required |
Optional fields and bindings. Use a consistent bucket interval and nonnegative values.
Example result.
date | category | value |
|---|---|---|
2025-01 | A | 100 |
2025-02 | A | 120 |
2025-01 | B | 50 |
Download the complete data example. Select this tile to load its preset settings, then use these column names in the visual builder or the example query.
Styling controls. Set series colors, legend, time labels and value formatting.
Interactions. Hover for values where a tooltip is shown. This renderer does not send mark selections to dashboard filters or drill-through.
Check before publishing. Keep categories consistent across periods and distinguish a missing bucket from a genuine zero.
Gantt
Standard · Picker tile gantt
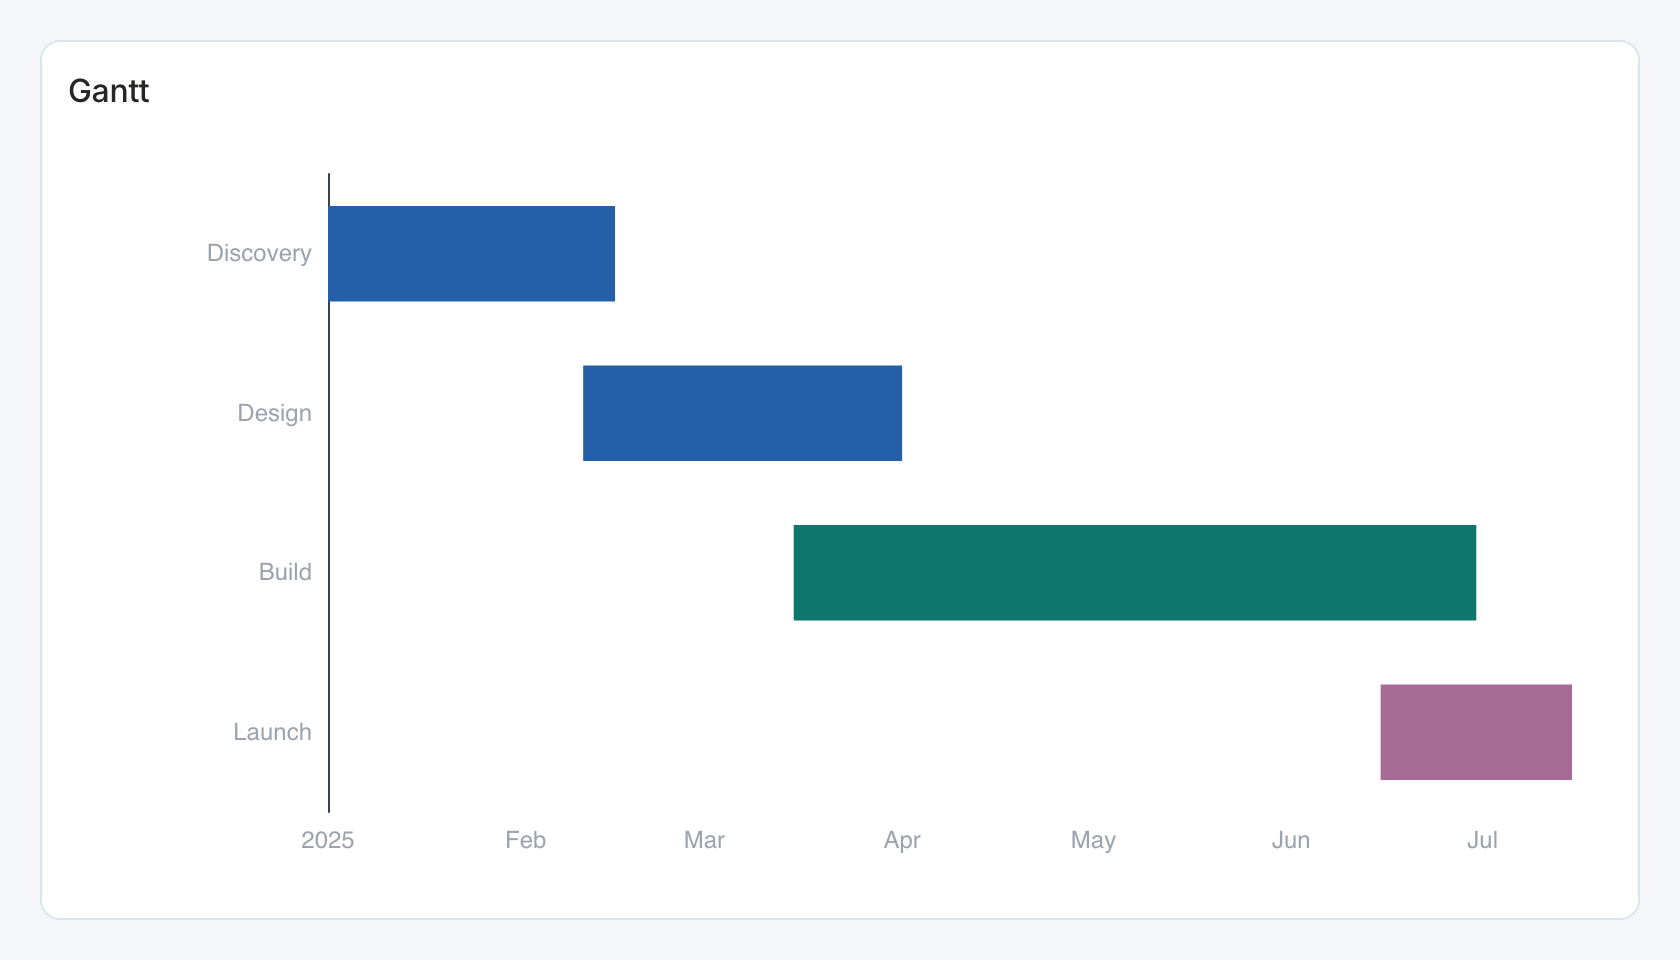
Required data and grain. One row per task. Columns are task label, ISO start date and ISO end date.
| Example field | Type | Role in this example |
|---|---|---|
task | Text | Required |
start_date | ISO date text | Required |
end_date | ISO date text | Required |
category | Text | Optional / available to map |
Optional fields and bindings. An optional fourth category column groups or colors tasks.
Example result — first three rows.
task | start_date | end_date | category |
|---|---|---|---|
Discovery | 2025-01-01 | 2025-02-15 | Phase 1 |
Design | 2025-02-10 | 2025-04-01 | Phase 1 |
Build | 2025-03-15 | 2025-06-30 | Phase 2 |
Download the complete data example. Select this tile to load its preset settings, then use these column names in the visual builder or the example query.
Styling controls. Set palette, task labels, date axis and grid. Increase height for every task row.
Interactions. Hover for values where a tooltip is shown. This renderer does not send mark selections to dashboard filters or drill-through.
Check before publishing. Each end date must be on or after the start date. Dependencies and critical-path scheduling are not computed.
Combo
Standard · Picker tile combo
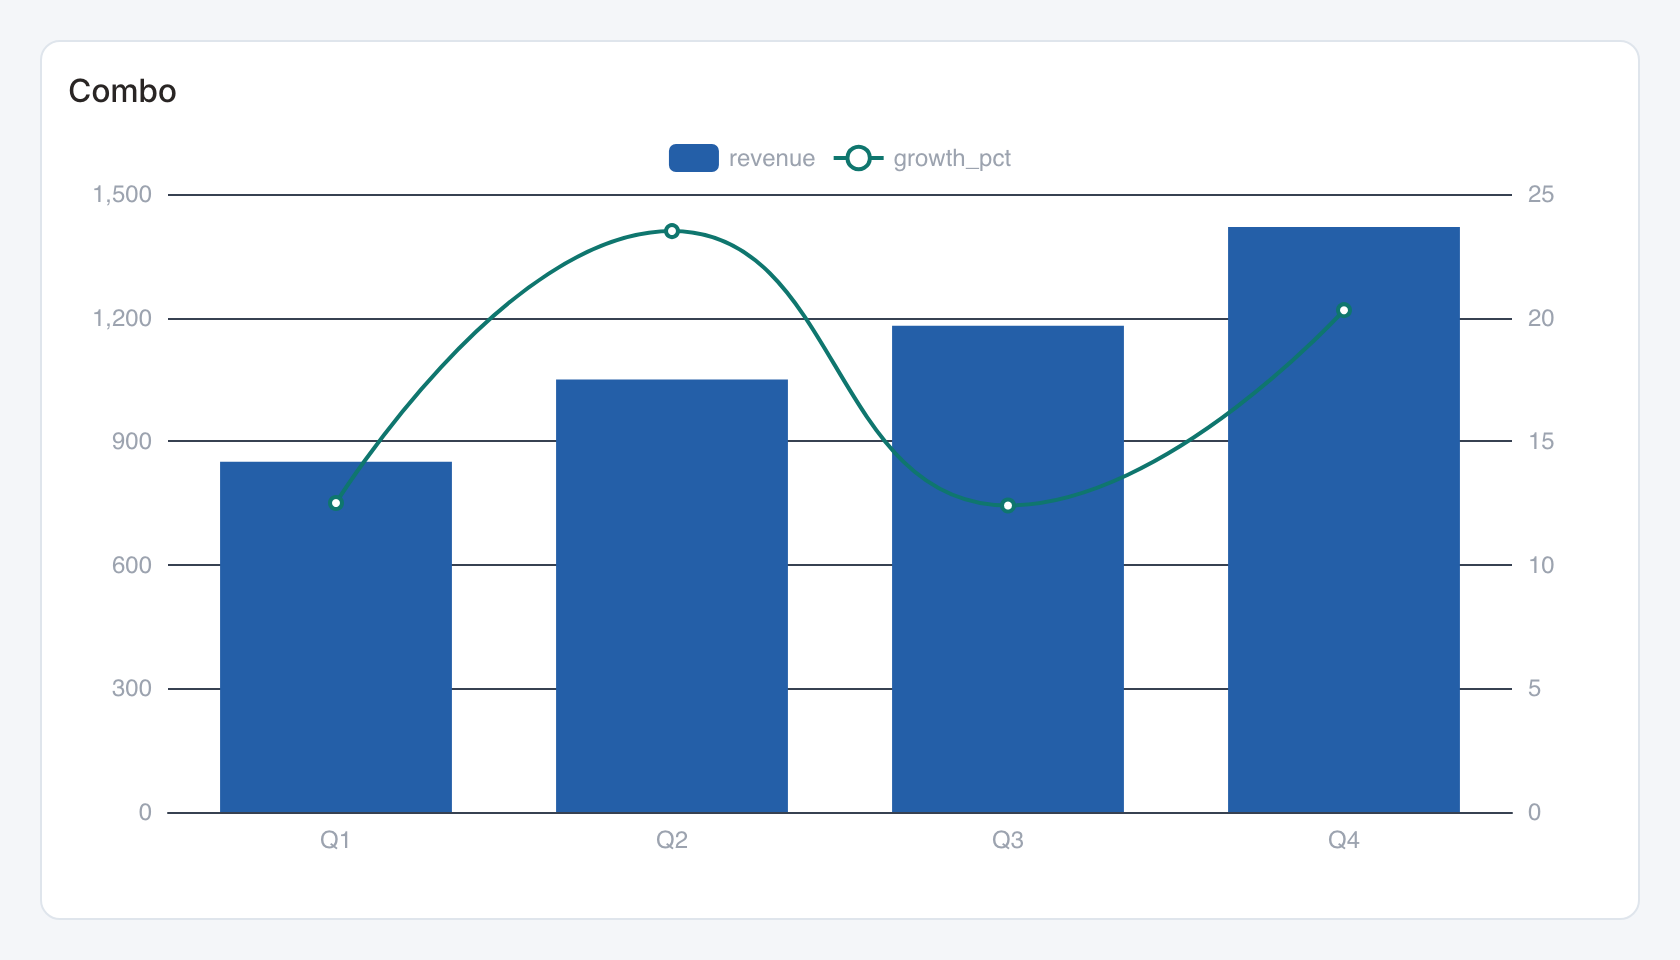
Required data and grain. Wide form, one row per x-axis category. First column is category, second bar value and third line value.
| Example field | Type | Role in this example |
|---|---|---|
category | Text | Required |
revenue | Number | Required |
growth_pct | Number | Required |
Optional fields and bindings. Further numeric columns can supply additional line series.
Example result — first three rows.
category | revenue | growth_pct |
|---|---|---|
Q1 | 850 | 12.5 |
Q2 | 1050 | 23.5 |
Q3 | 1180 | 12.4 |
Download the complete data example. Select this tile to load its preset settings, then use these column names in the visual builder or the example query.
Styling controls. Set palette, legend, grid and series options. Give each axis a title and a value format when units differ.
Interactions. Hover for values where a tooltip is shown. This renderer does not send mark selections to dashboard filters or drill-through.
Check before publishing. The sample growth_pct values use percentage points such as 12.5. Convert to 0.125 before applying a fractional percent formatter.
Trend comparison grid
Specialized widget · Picker tile trend-grid
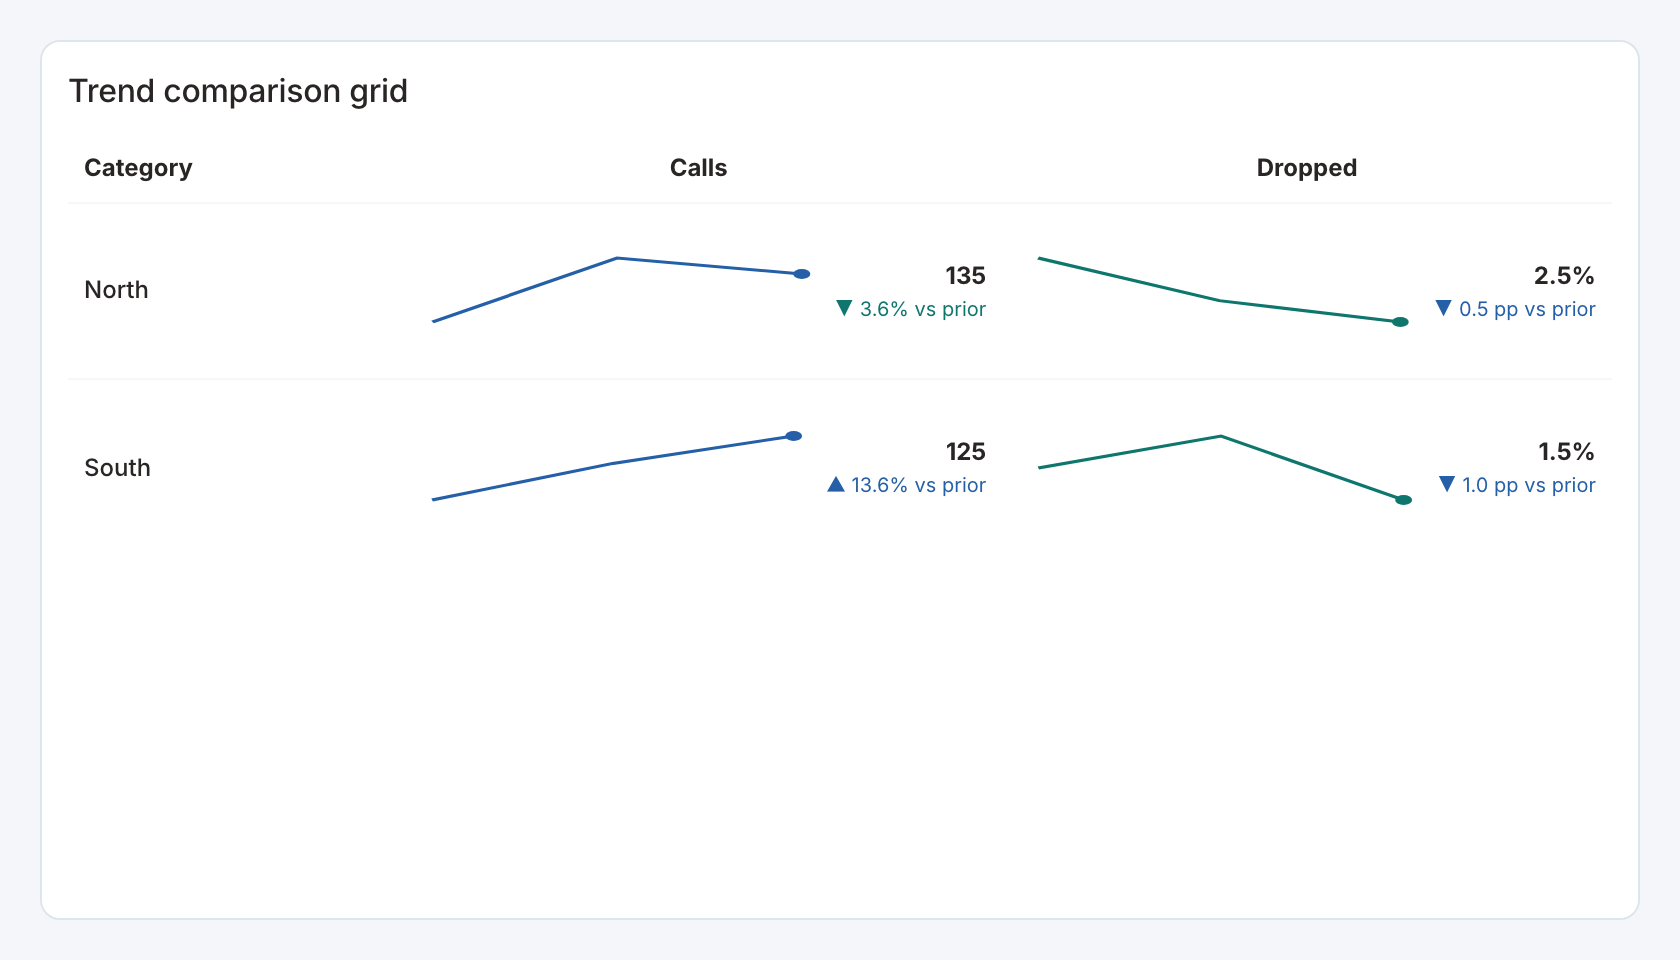
Required data and grain. Long form, one row per category and ordered period, with numeric measure columns.
| Example field | Type | Role in this example |
|---|---|---|
category | Text | Required |
period | Number | Required |
calls | Number | Required |
drop_rate | Number | Required |
Optional fields and bindings. Add more measure definitions and optional dashboard period bindings.
Example result — first three rows.
category | period | calls | drop_rate |
|---|---|---|---|
North | 1 | 120 | 0.04 |
North | 2 | 140 | 0.03 |
North | 3 | 135 | 0.025 |
Download the complete data example. Select this tile to load its preset settings, then use these column names in the visual builder or the example query.
Styling controls. Trend grid controls set row/time fields, measure columns, labels, mini-trend display, number formats, change mode and whether lower is better.
Interactions. Row labels can select a category for configured actions. Viewers can inspect each row’s current value, change and trend.
Check before publishing. The starter drop_rate is a fraction. Points mode compares percentage-point changes, while percentage change uses a relative denominator.
Calendar with daily detail
Specialized widget · Picker tile weekday-calendar
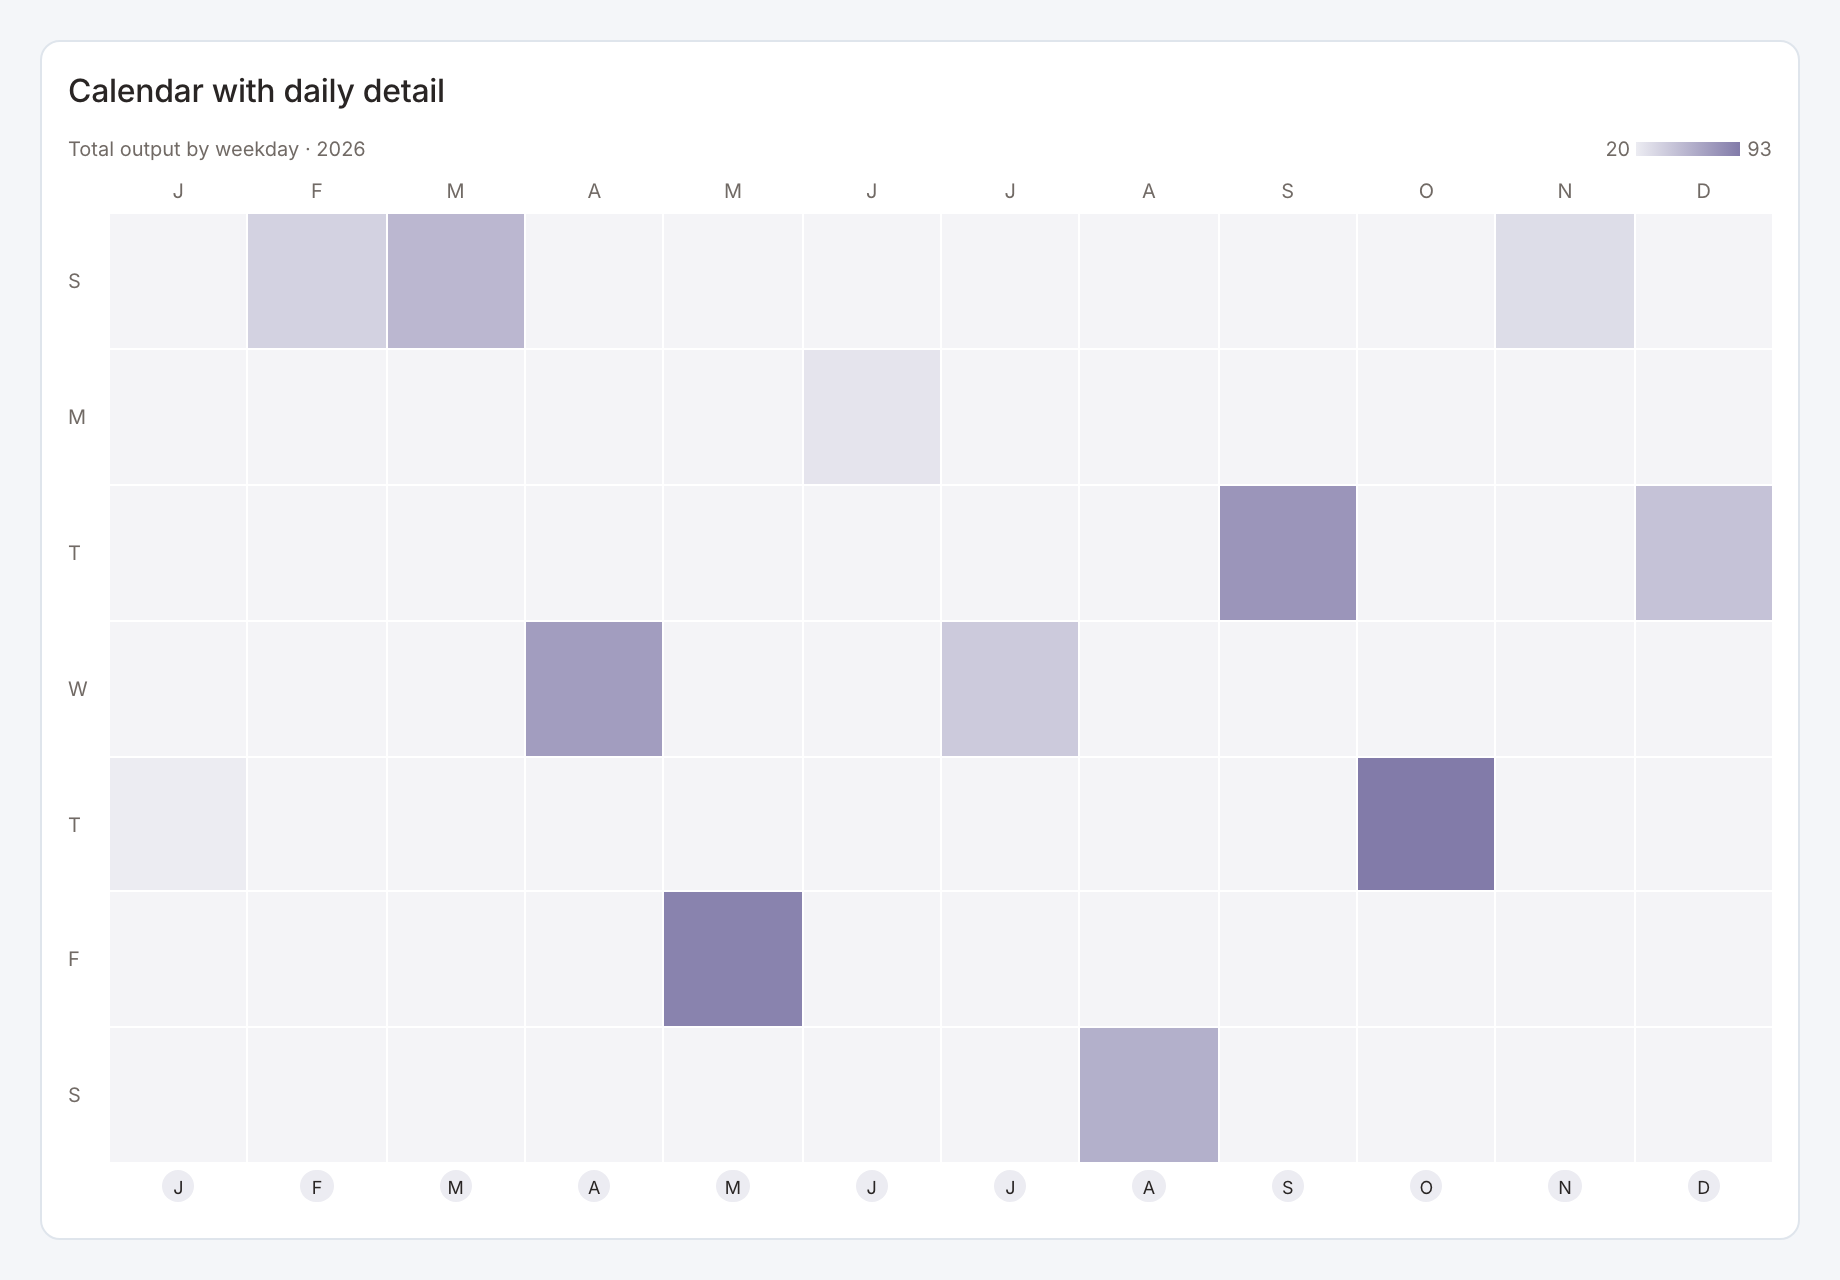
Required data and grain. One row per ISO date and numeric measure.
| Example field | Type | Role in this example |
|---|---|---|
day | ISO date text | Required |
value | Number | Required |
Optional fields and bindings. A year filter can select which dates to display. The calendar aggregation defines how repeated dates combine.
Example result — first three rows.
day | value |
|---|---|
2026-01-15 | 20 |
2026-02-15 | 37 |
2026-03-15 | 54 |
Download the complete data example. Select this tile to load its preset settings, then use these column names in the visual builder or the example query.
Styling controls. Set year, aggregation, palette, daily details, labels and calendar presentation.
Interactions. Inspect the calendar and daily detail list. Configure supported date or period bindings when using it with dashboard filters.
Check before publishing. Keep zero days if zero is meaningful. Missing dates should represent unavailable data, rather than silently changing to zero.
Grouped time series
Specialized widget · Picker tile grouped-trend
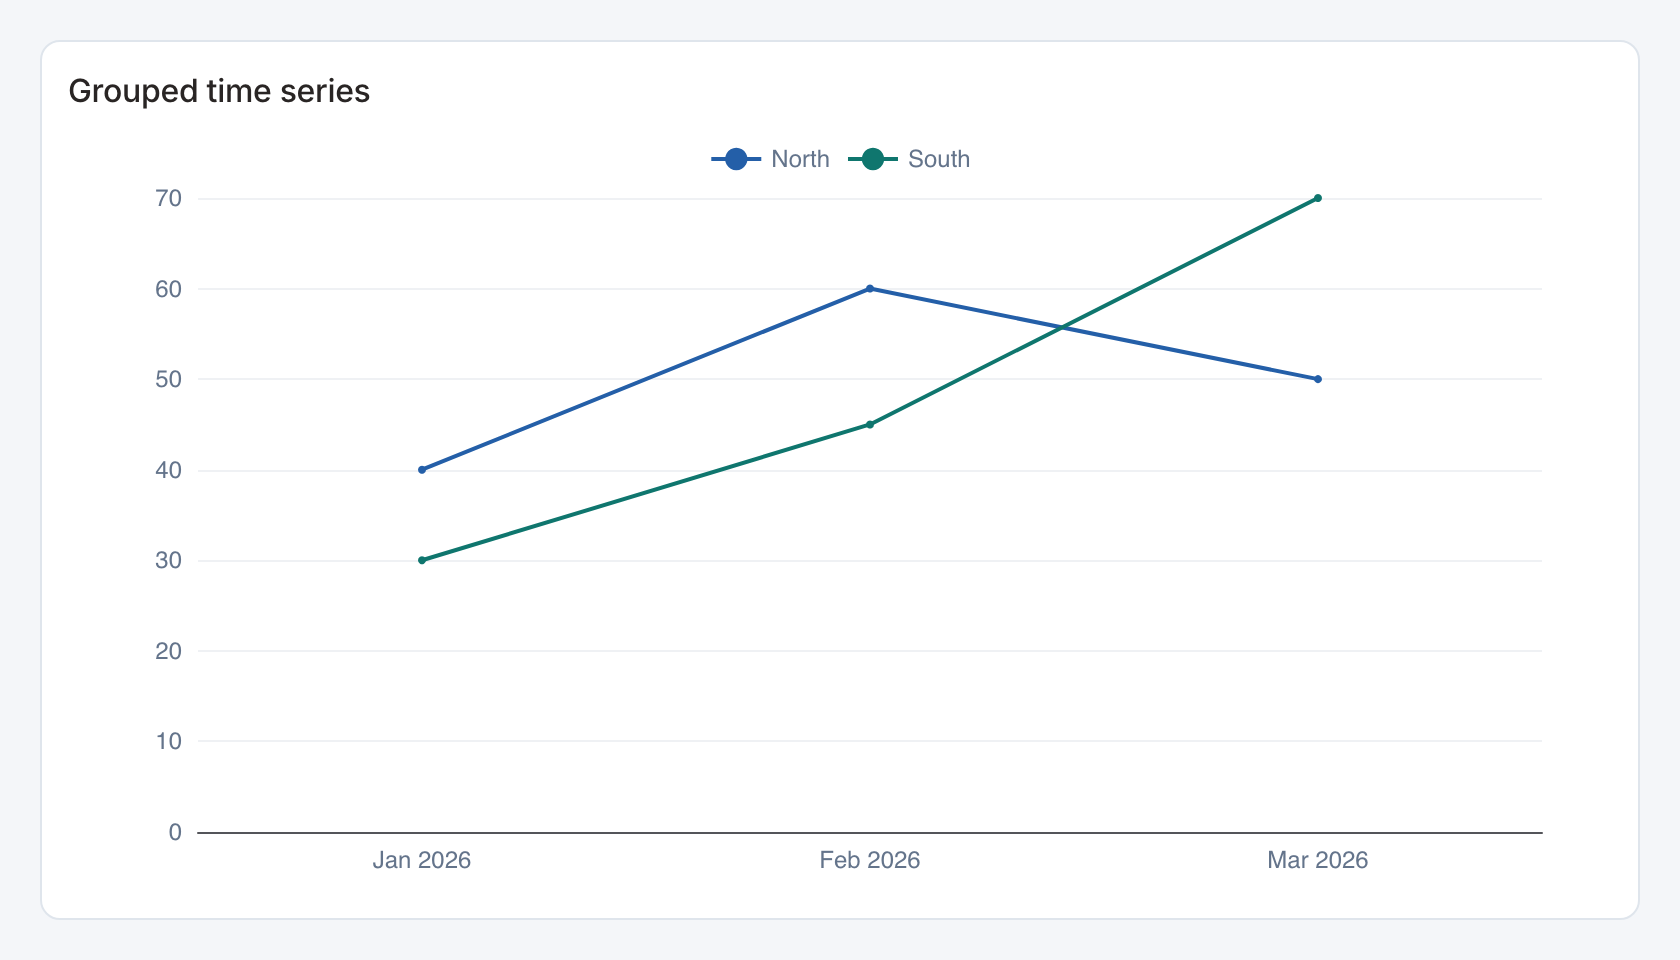
Required data and grain. Long form, one row per x-axis period and series group, with a numeric value.
| Example field | Type | Role in this example |
|---|---|---|
period | ISO date text | Required |
segment | Text | Required |
value | Number | Required |
Optional fields and bindings. Add optional series configuration and dashboard period bindings.
Example result — first three rows.
period | segment | value |
|---|---|---|
2026-01-01 | North | 40 |
2026-02-01 | North | 60 |
2026-03-01 | North | 50 |
Download the complete data example. Select this tile to load its preset settings, then use these column names in the visual builder or the example query.
Styling controls. Series controls set x/value/group bindings. Choose line mode and point visibility. Choose date-label format, palette, axes, labels, grid and legend.
Interactions. Toggle series in the legend and select an x-axis bucket for a configured filter or drill-through action.
Check before publishing. Group repeated period/series pairs deliberately in the source. For indexed views, a missing or zero baseline needs attention before interpreting relative change.
Stacked area series
Specialized widget · Picker tile area-trend
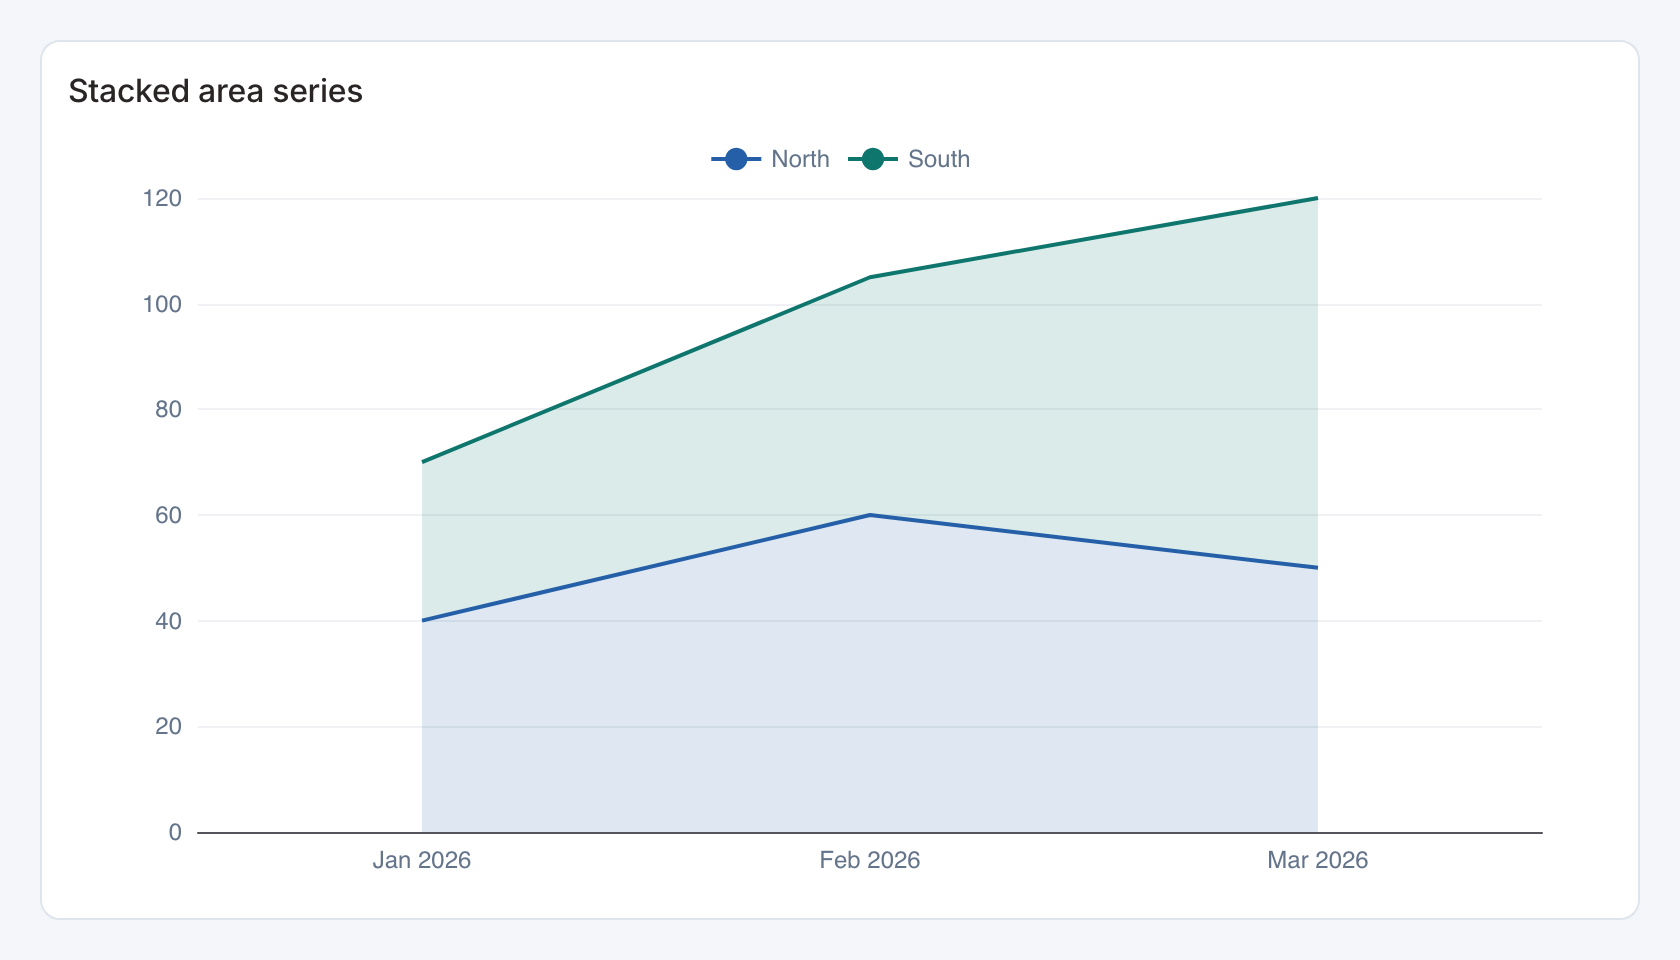
Required data and grain. Long form, one row per x-axis period and series group, with a numeric value.
| Example field | Type | Role in this example |
|---|---|---|
period | ISO date text | Required |
segment | Text | Required |
value | Number | Required |
Optional fields and bindings. Add optional series configuration and dashboard period bindings.
Example result — first three rows.
period | segment | value |
|---|---|---|
2026-01-01 | North | 40 |
2026-02-01 | North | 60 |
2026-03-01 | North | 50 |
Download the complete data example. Select this tile to load its preset settings, then use these column names in the visual builder or the example query.
Styling controls. Series controls set x/value/group bindings. Choose area mode and stacking. Choose date-label format, palette, axes, labels, grid and legend.
Interactions. Toggle series in the legend and select an x-axis bucket for a configured filter or drill-through action.
Check before publishing. Group repeated period/series pairs deliberately in the source. For indexed views, a missing or zero baseline needs attention before interpreting relative change.
Grouped / stacked bars
Specialized widget · Picker tile stacked-series
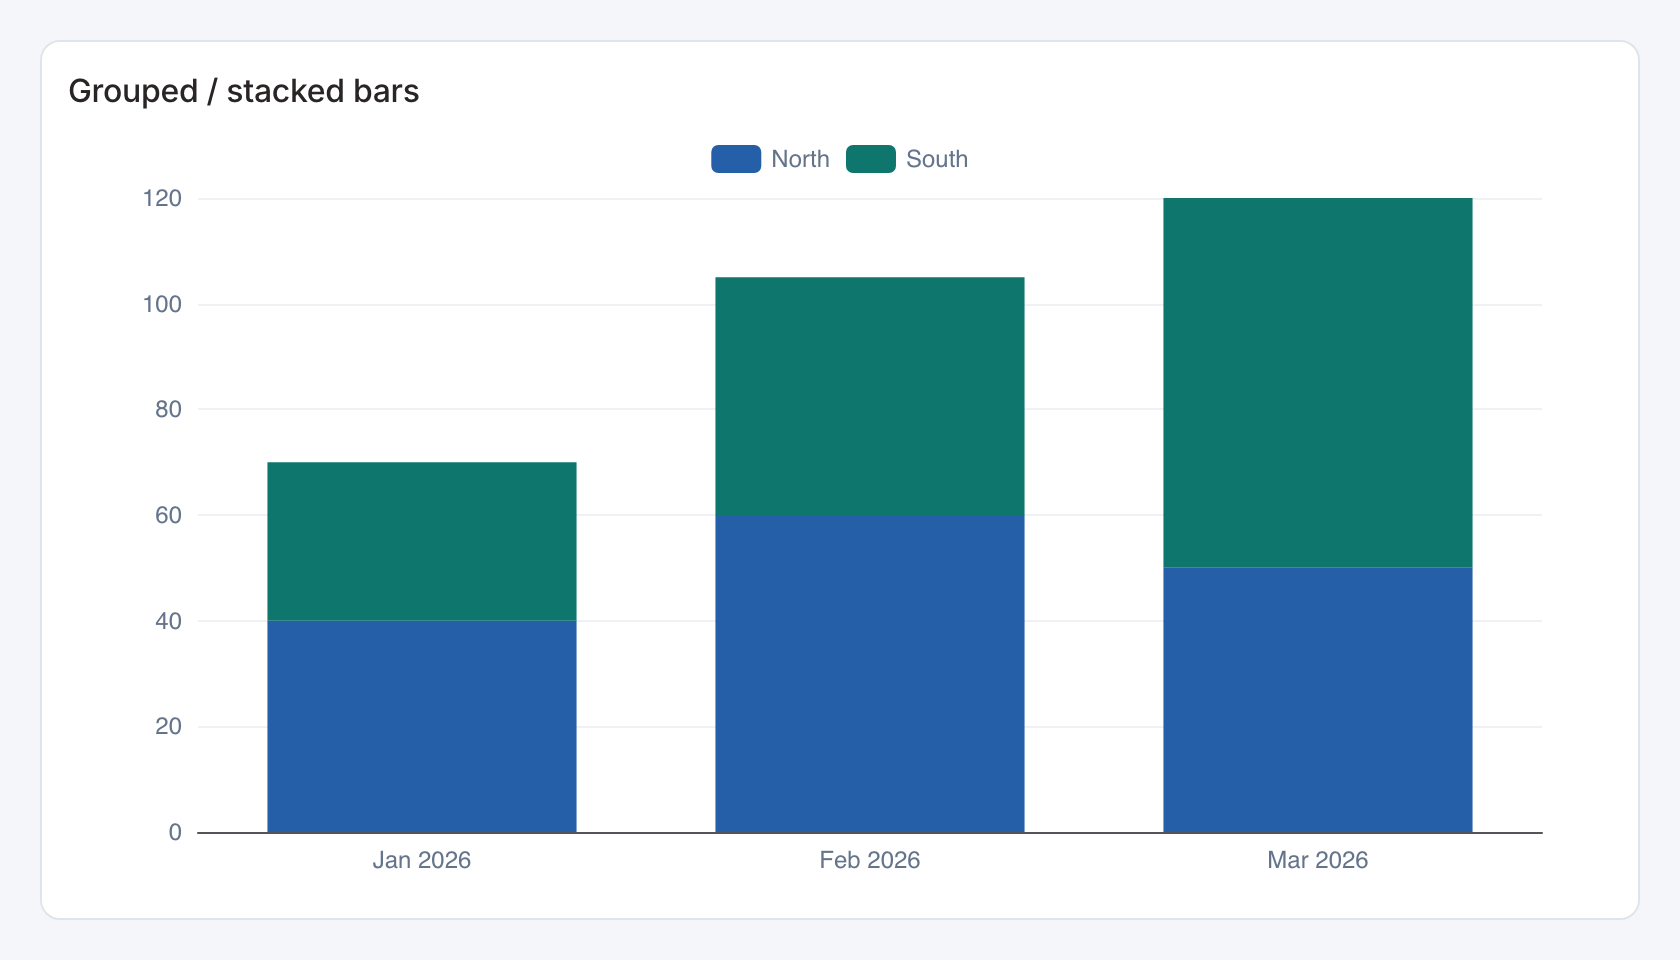
Required data and grain. Long form, one row per x-axis period and series group, with a numeric value.
| Example field | Type | Role in this example |
|---|---|---|
period | ISO date text | Required |
segment | Text | Required |
value | Number | Required |
Optional fields and bindings. Add optional series configuration and dashboard period bindings.
Example result — first three rows.
period | segment | value |
|---|---|---|
2026-01-01 | North | 40 |
2026-02-01 | North | 60 |
2026-03-01 | North | 50 |
Download the complete data example. Select this tile to load its preset settings, then use these column names in the visual builder or the example query.
Styling controls. Series controls set x/value/group bindings. Choose bar mode and grouped or stacked display. Choose date-label format, palette, axes, labels, grid and legend.
Interactions. Toggle series in the legend and select an x-axis bucket for a configured filter or drill-through action.
Check before publishing. Group repeated period/series pairs deliberately in the source. For indexed views, a missing or zero baseline needs attention before interpreting relative change.
Indexed time series
Specialized widget · Picker tile indexed-trend
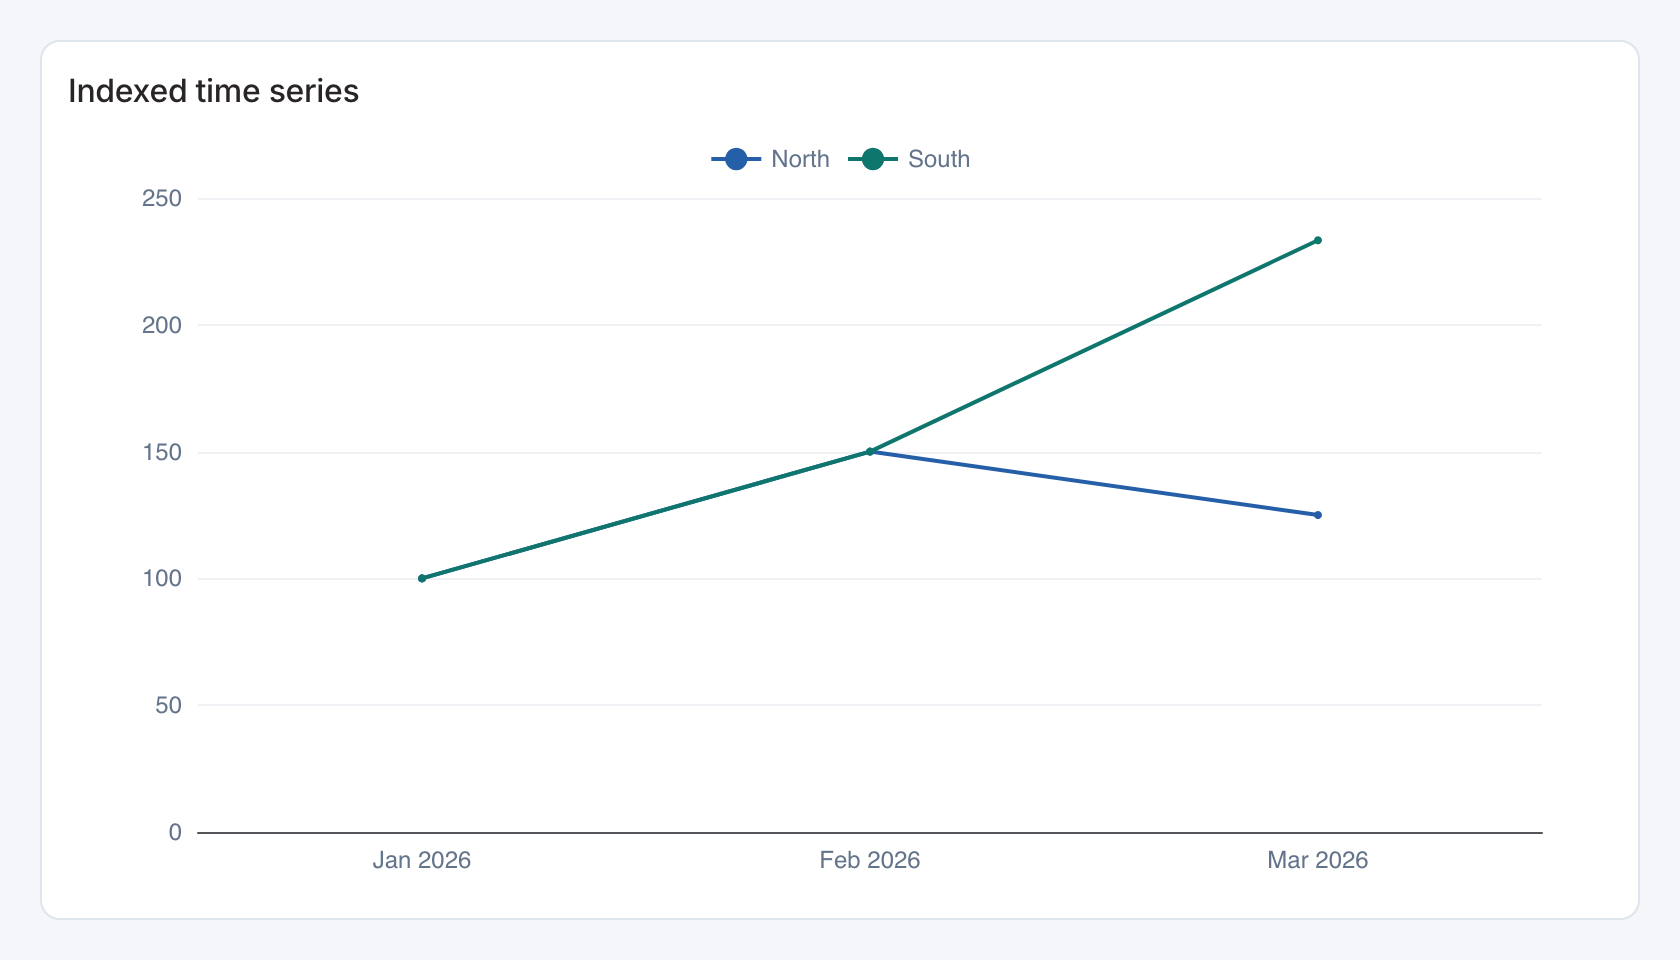
Required data and grain. Long form, one row per x-axis period and series group, with a numeric value.
| Example field | Type | Role in this example |
|---|---|---|
period | ISO date text | Required |
segment | Text | Required |
value | Number | Required |
Optional fields and bindings. Add optional series configuration and dashboard period bindings.
Example result — first three rows.
period | segment | value |
|---|---|---|
2026-01-01 | North | 40 |
2026-02-01 | North | 60 |
2026-03-01 | North | 50 |
Download the complete data example. Select this tile to load its preset settings, then use these column names in the visual builder or the example query.
Styling controls. Series controls set x/value/group bindings. Enable indexing to compare relative change from the series baseline. Choose date-label format, palette, axes, labels, grid and legend.
Interactions. Toggle series in the legend and select an x-axis bucket for a configured filter or drill-through action.
Check before publishing. Group repeated period/series pairs deliberately in the source. For indexed views, a missing or zero baseline needs attention before interpreting relative change.
Stepped time series
Specialized widget · Picker tile stepped-trend
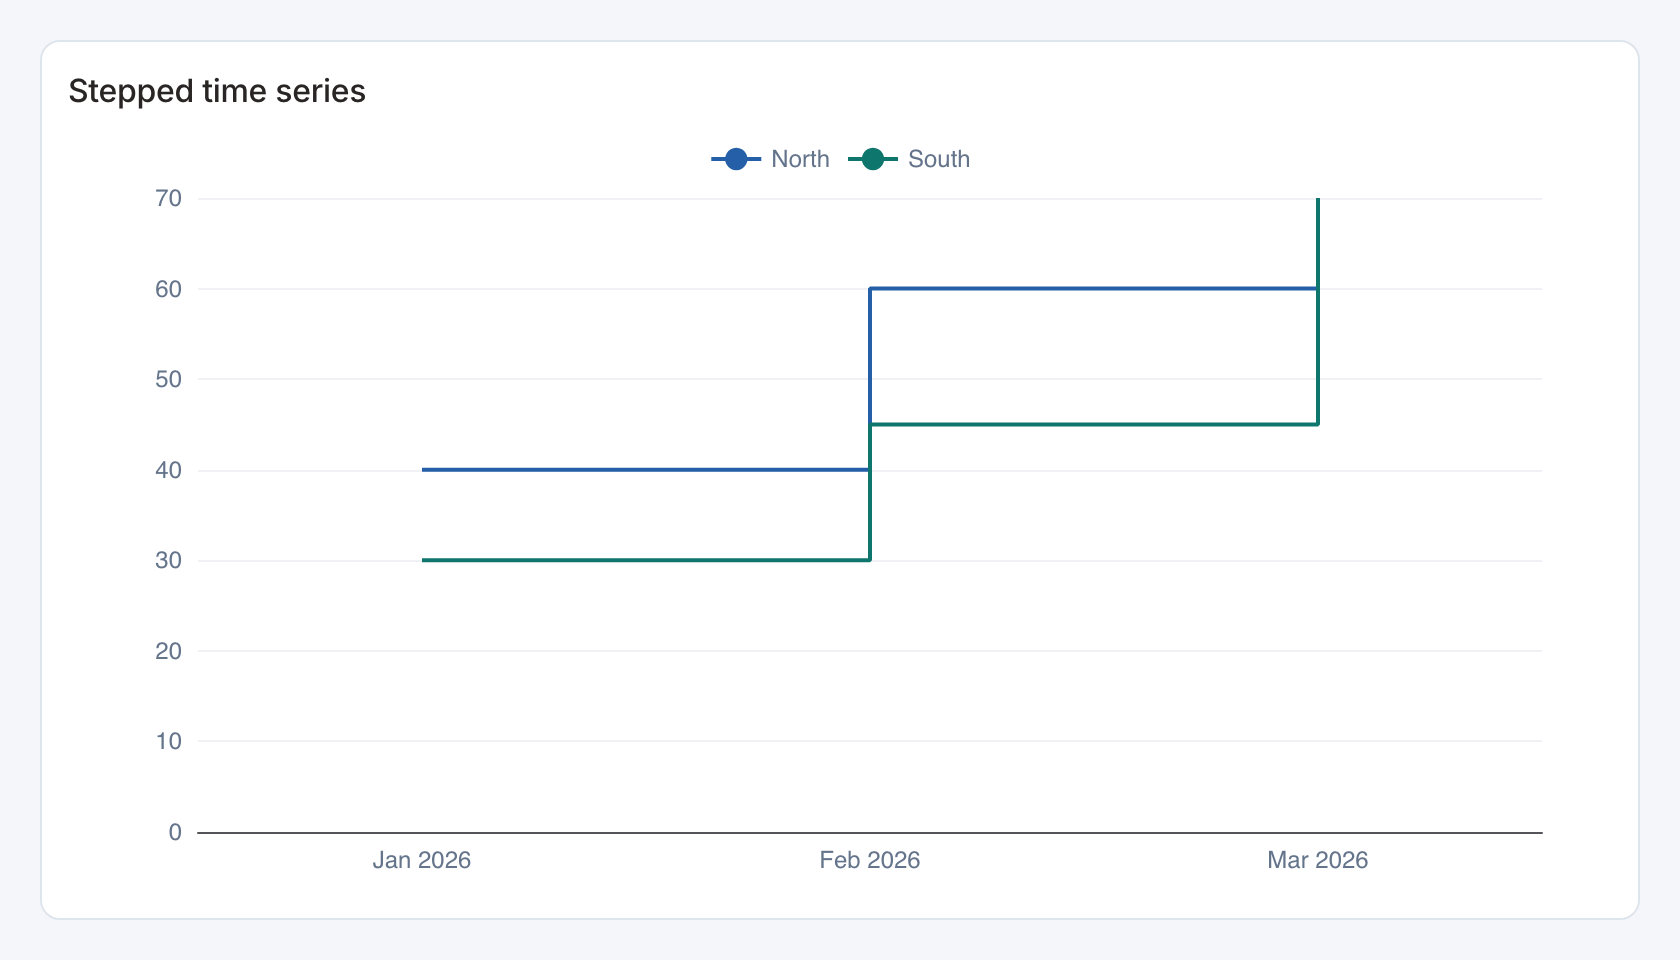
Required data and grain. Long form, one row per x-axis period and series group, with a numeric value.
| Example field | Type | Role in this example |
|---|---|---|
period | ISO date text | Required |
segment | Text | Required |
value | Number | Required |
Optional fields and bindings. Add optional series configuration and dashboard period bindings.
Example result — first three rows.
period | segment | value |
|---|---|---|
2026-01-01 | North | 40 |
2026-02-01 | North | 60 |
2026-03-01 | North | 50 |
Download the complete data example. Select this tile to load its preset settings, then use these column names in the visual builder or the example query.
Styling controls. Series controls set x/value/group bindings. Enable stepped lines for changes that take effect at a bucket boundary. Choose date-label format, palette, axes, labels, grid and legend.
Interactions. Toggle series in the legend and select an x-axis bucket for a configured filter or drill-through action.
Check before publishing. Group repeated period/series pairs deliberately in the source. For indexed views, a missing or zero baseline needs attention before interpreting relative change.
Selectable daily calendar
Specialized widget · Picker tile daily-calendar
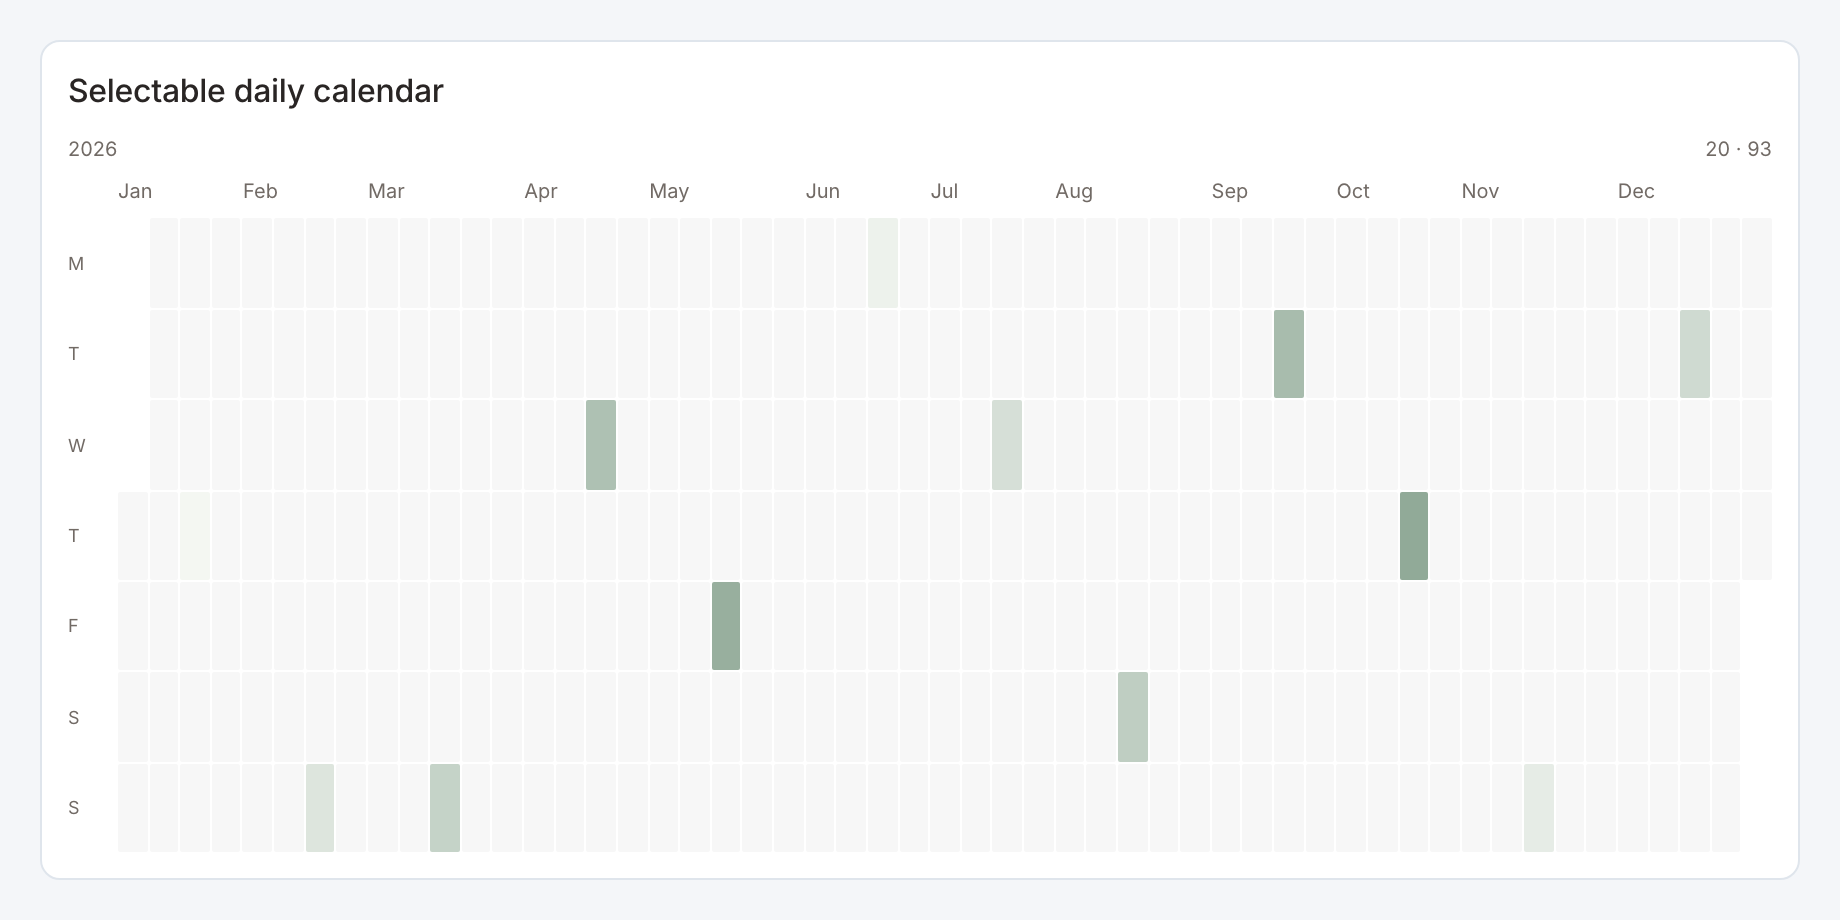
Required data and grain. One row per ISO date and numeric value.
| Example field | Type | Role in this example |
|---|---|---|
day | ISO date text | Required |
value | Number | Required |
Optional fields and bindings. A year filter can choose the calendar year. Configure date or month selection to match the receiving filter.
Example result — first three rows.
day | value |
|---|---|
2026-01-15 | 20 |
2026-02-15 | 37 |
2026-03-15 | 54 |
Download the complete data example. Select this tile to load its preset settings, then use these column names in the visual builder or the example query.
Styling controls. Set week start, year, selection unit, colors and date labels.
Interactions. Select a date or month using the configured calendar action. The starter uses month selection.
Check before publishing. A month selection and a date selection have different filter values. Test the receiving widget with the selected unit.
Monthly calendar heatmap
Specialized widget · Picker tile monthly-calendar
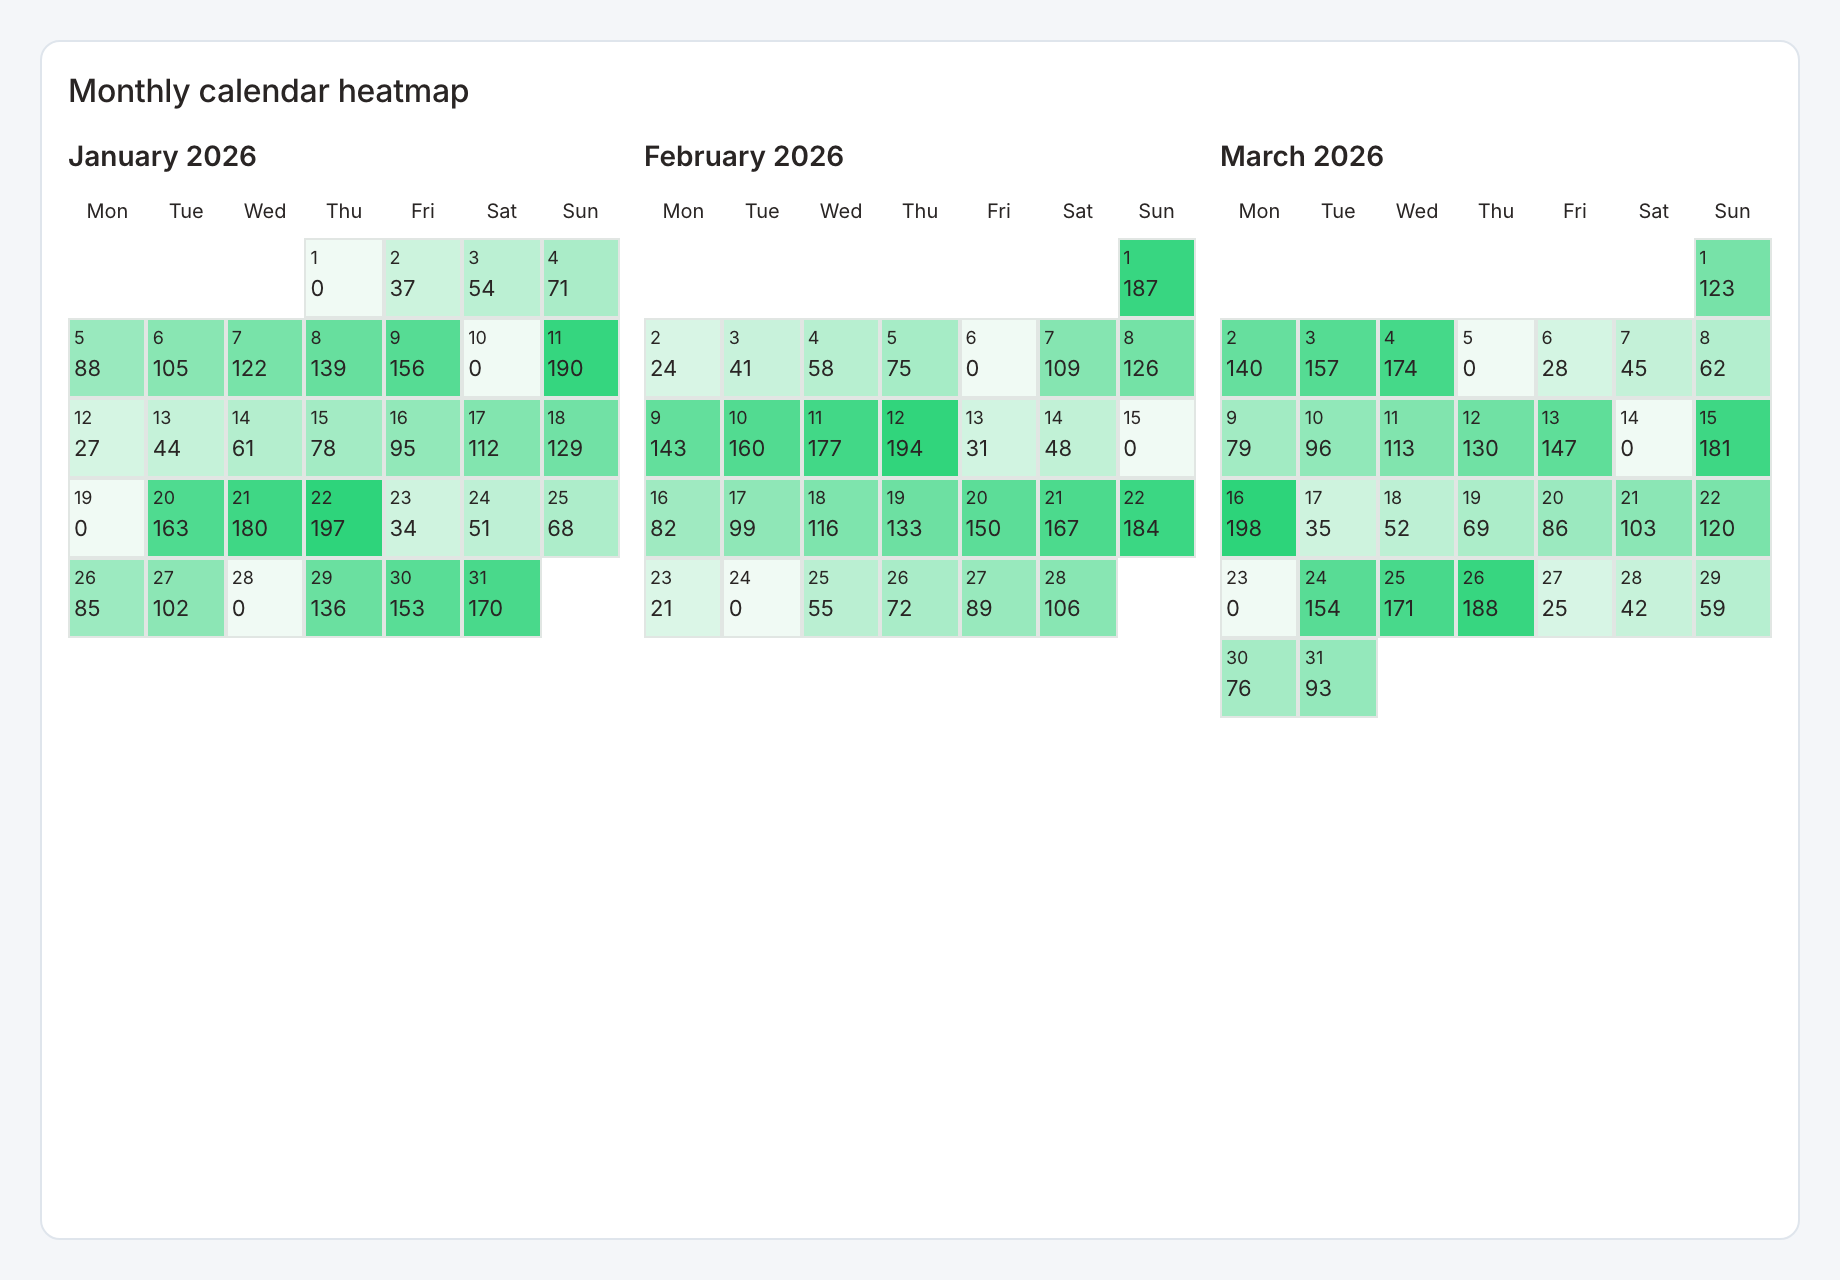
Required data and grain. One row per ISO date and numeric value across the desired months.
| Example field | Type | Role in this example |
|---|---|---|
day | ISO date text | Required |
value | Number | Required |
Optional fields and bindings. Include zero days explicitly. Controls can show months from the data or a configured range.
Example result — first three rows.
day | value |
|---|---|
2026-01-01 | 0 |
2026-01-02 | 37 |
2026-01-03 | 54 |
Download the complete data example. Select this tile to load its preset settings, then use these column names in the visual builder or the example query.
Styling controls. Choose months-per-row, range, week start, day numbers, values, palette, label styling and cell layout.
Interactions. The starter uses date selection but disables automatic cross-filtering. Configure an explicit date action or binding before expecting another widget to change.
Check before publishing. A small card can compress day cells. Increase its size or reduce months per row rather than dropping dates.
Dual-axis metric comparison
Specialized widget · Picker tile metric-comparison
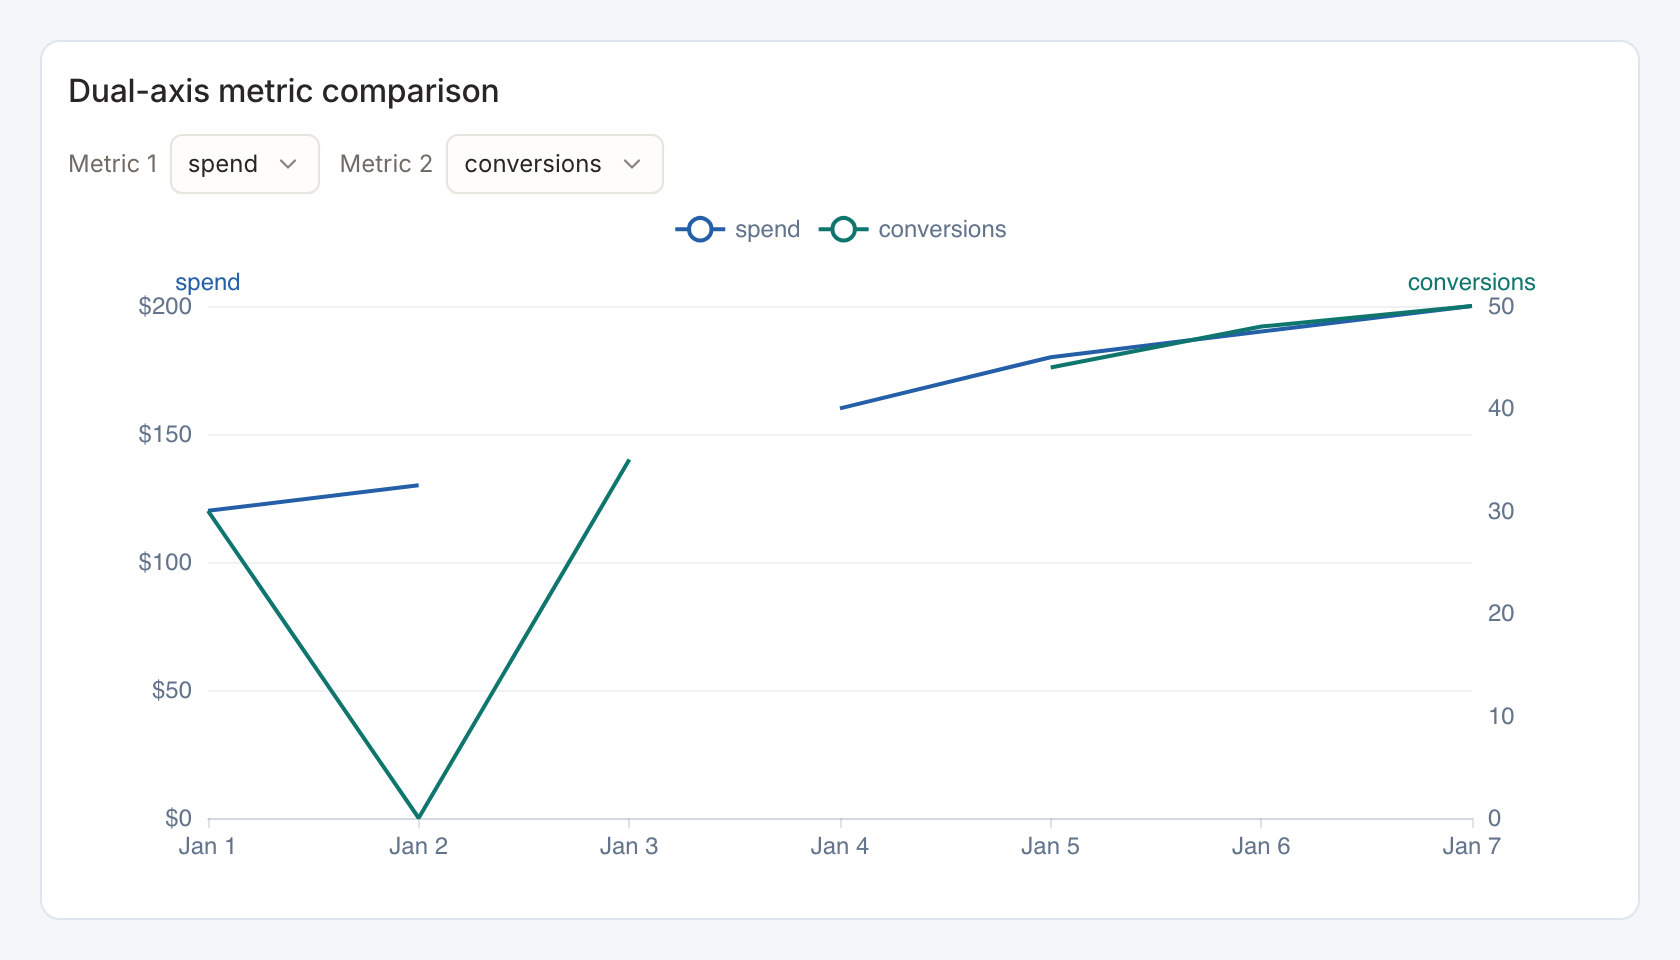
Required data and grain. Wide form, one row per ordered x-axis bucket, with numeric left and right measures.
| Example field | Type | Role in this example |
|---|---|---|
day | ISO date text | Required |
spend | Number | Required |
conversions | Number | Required |
Optional fields and bindings. Add candidate numeric fields to expose them in viewer metric selectors.
Example result — first three rows.
day | spend | conversions |
|---|---|---|
2026-01-01 | 120 | 30 |
2026-01-02 | 130 | 0 |
2026-01-03 | — | 35 |
Download the complete data example. Select this tile to load its preset settings, then use these column names in the visual builder or the example query.
Styling controls. Comparison controls choose x, left/right fields, dual-axis behavior, allowed metric selection, colors, series styling and per-measure formats.
Interactions. Viewers can choose allowed comparison metrics. Hover to inspect values and test any configured bucket action in the selected chart mode.
Check before publishing. Give both axes clear units. Similar line heights on independent scales do not imply equal magnitudes.